2016
96x34x16in
LEDs, servos, electronics, aluminum
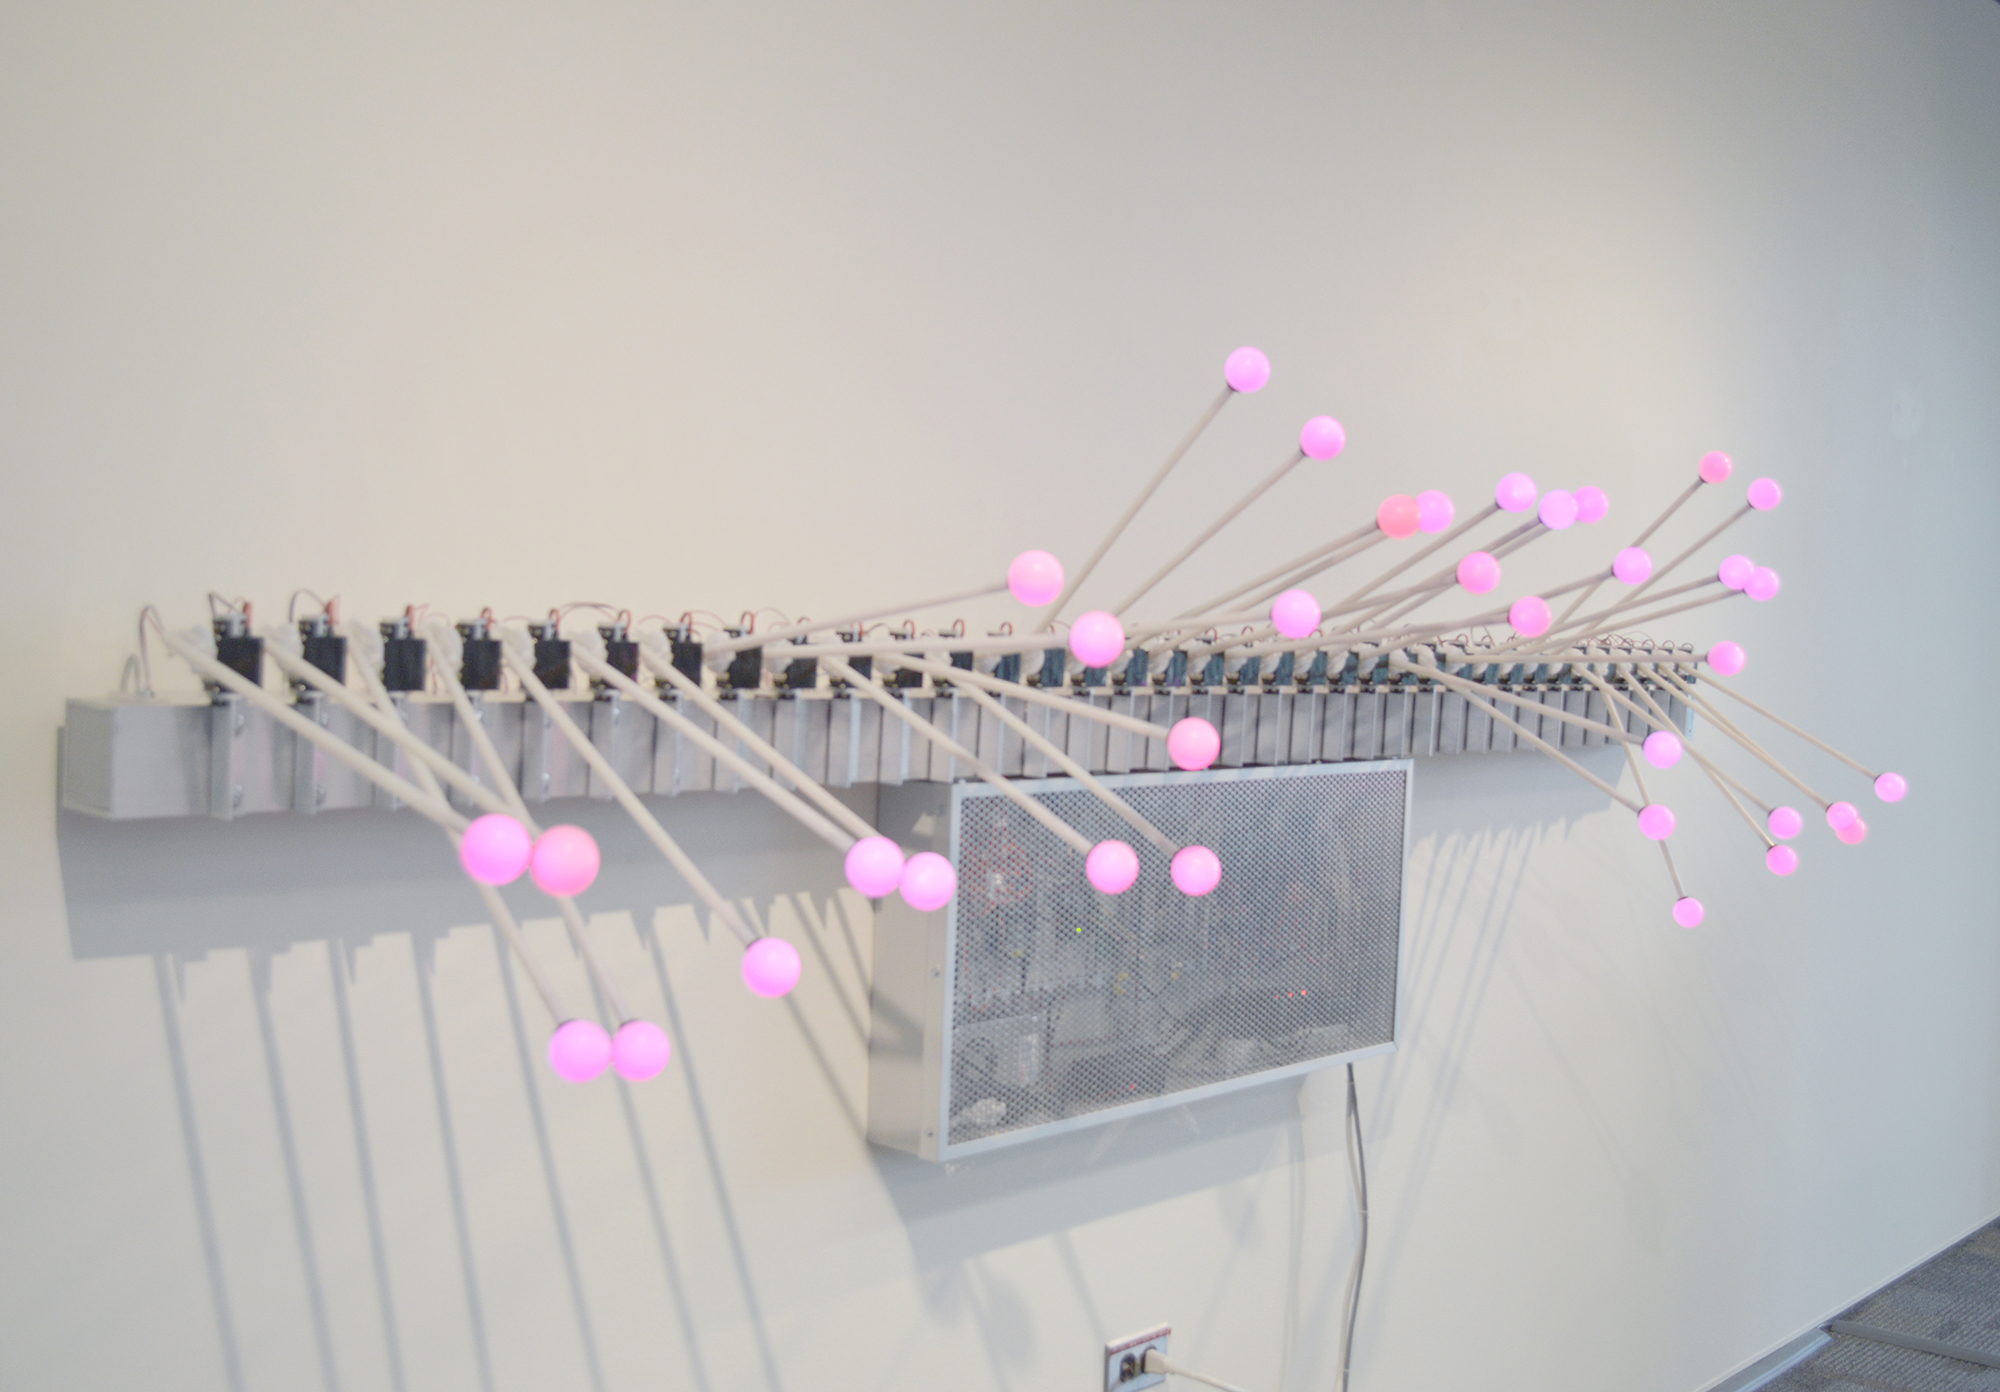
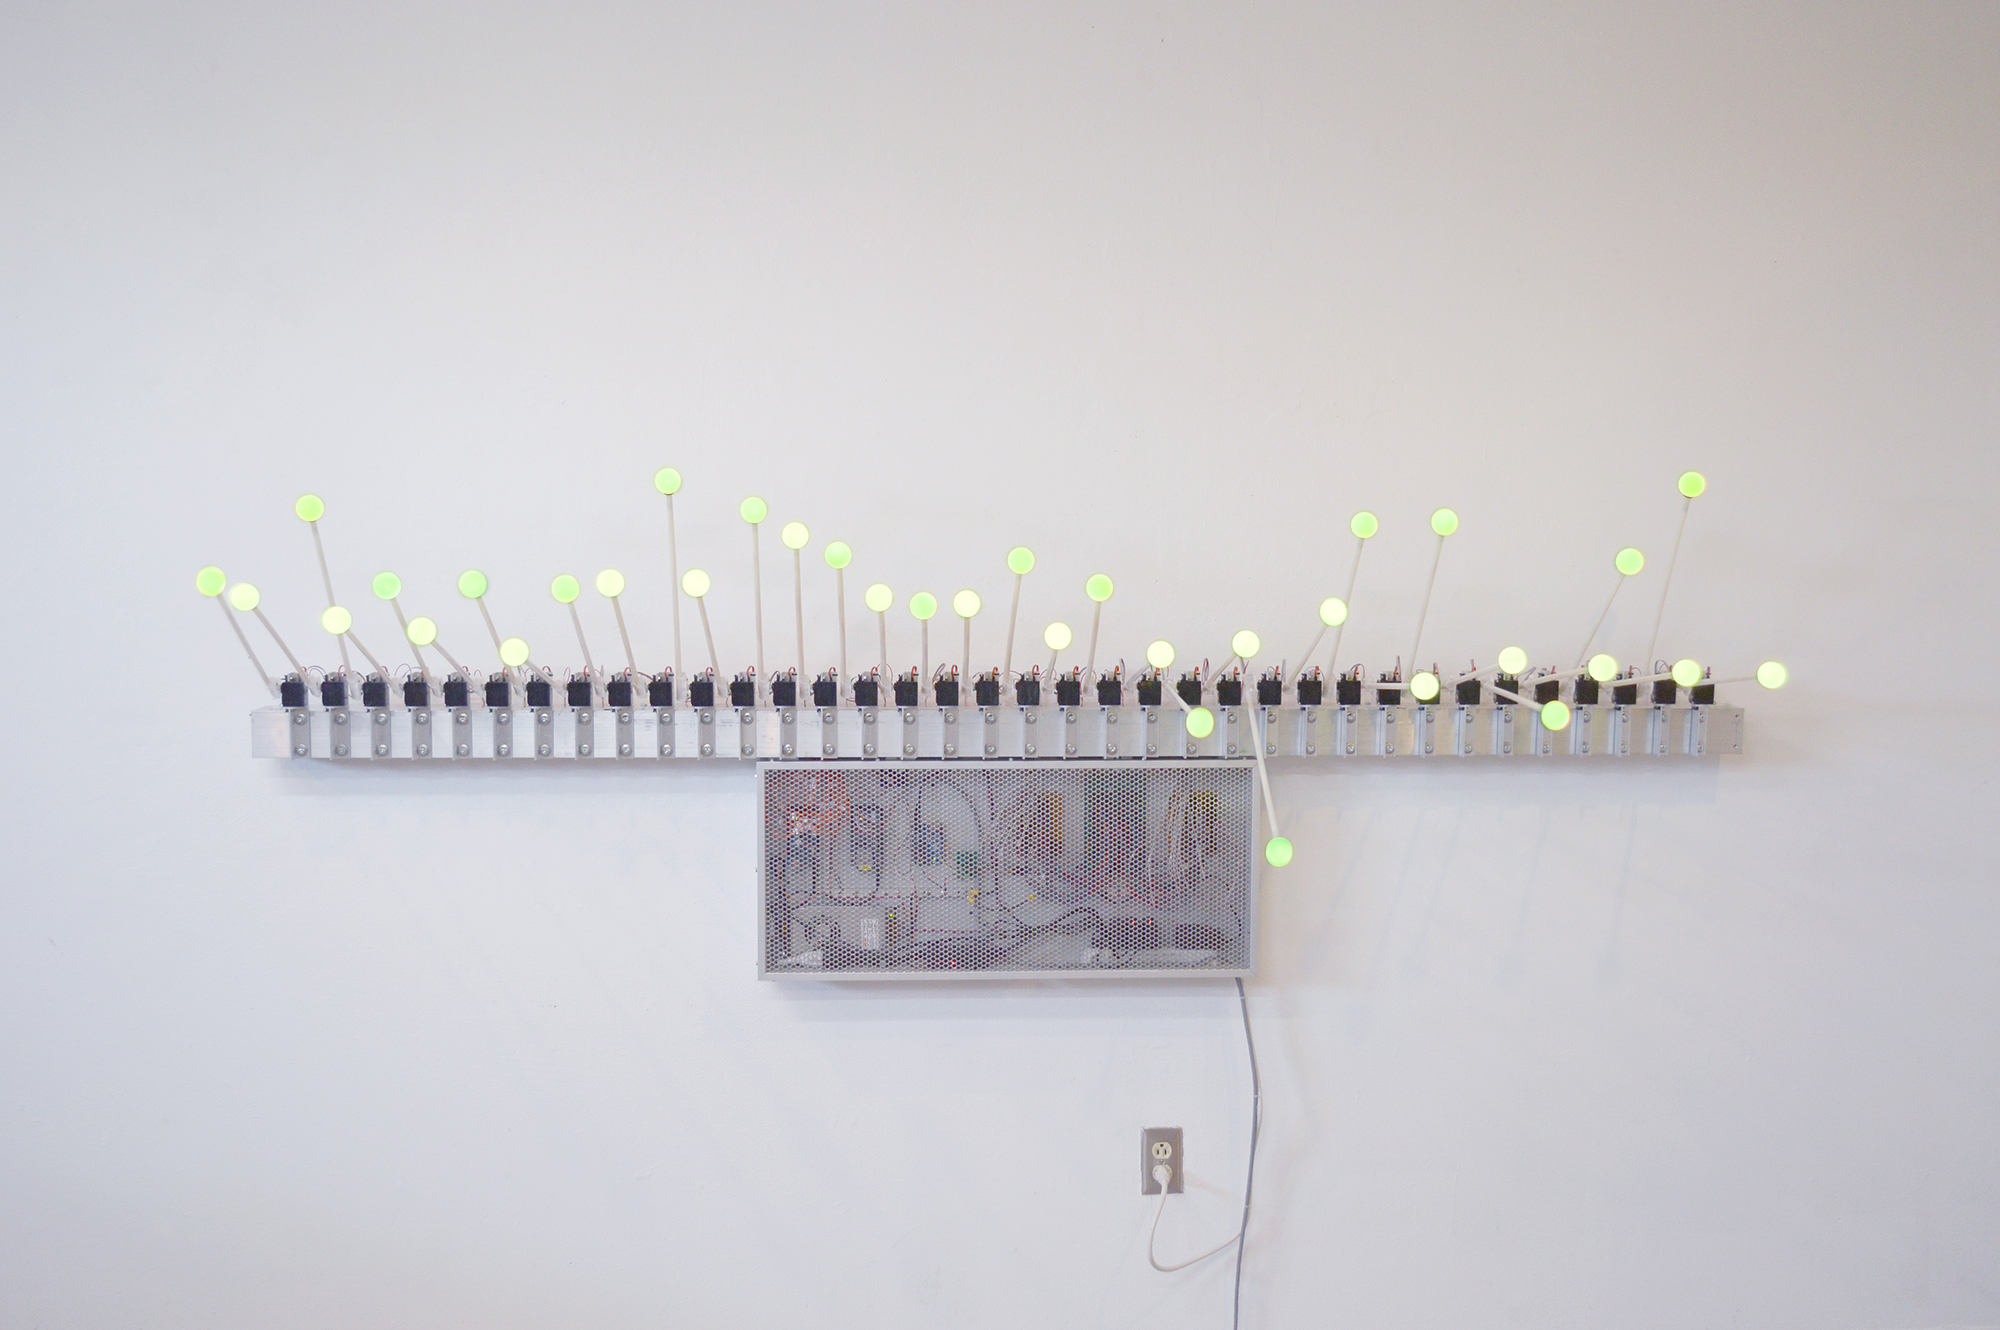
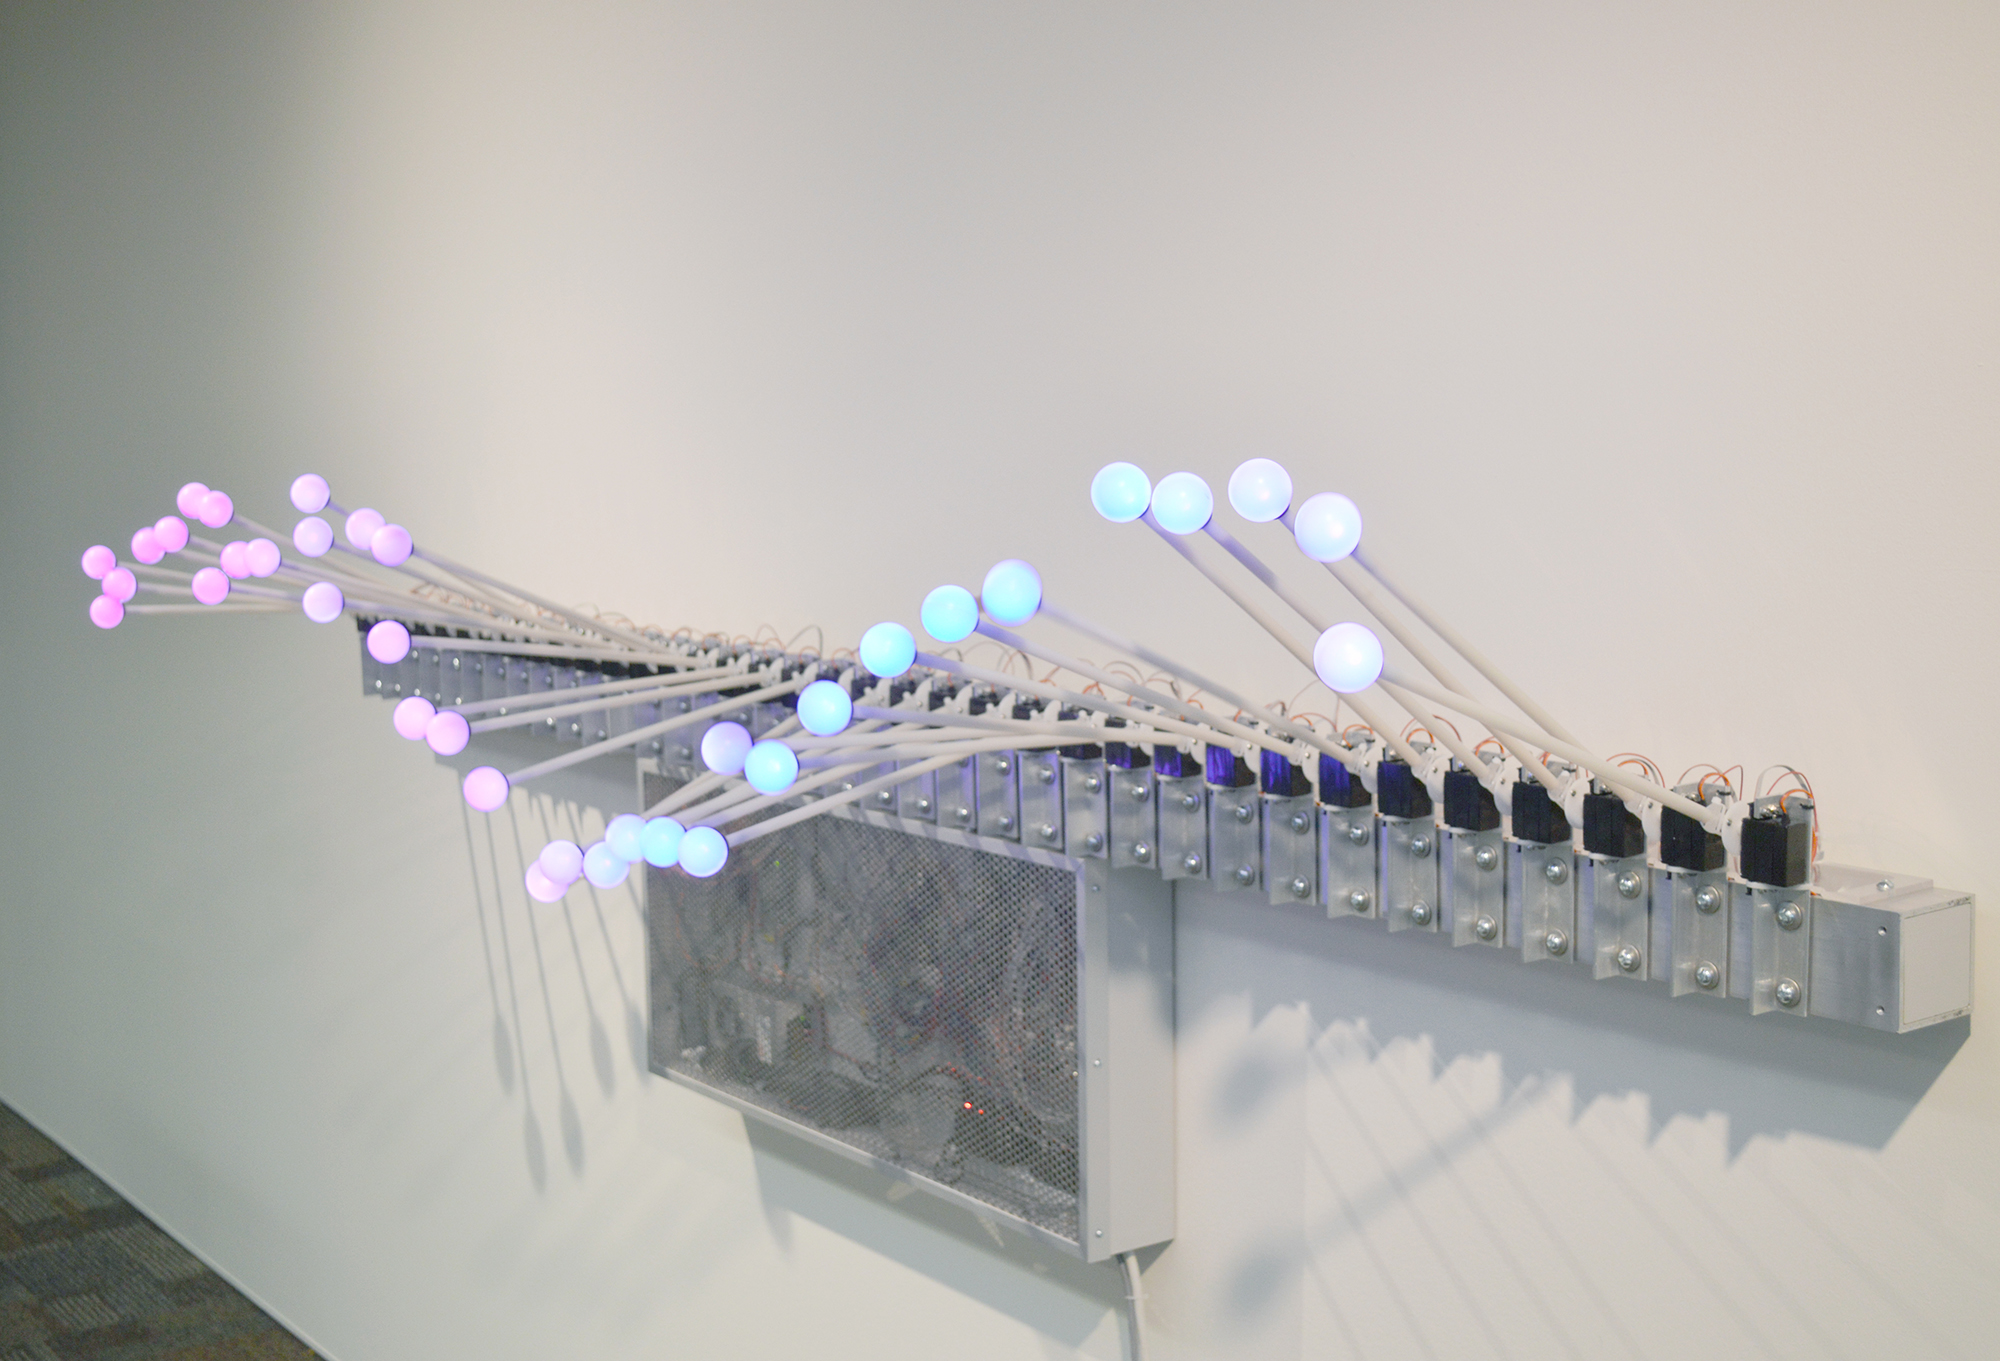
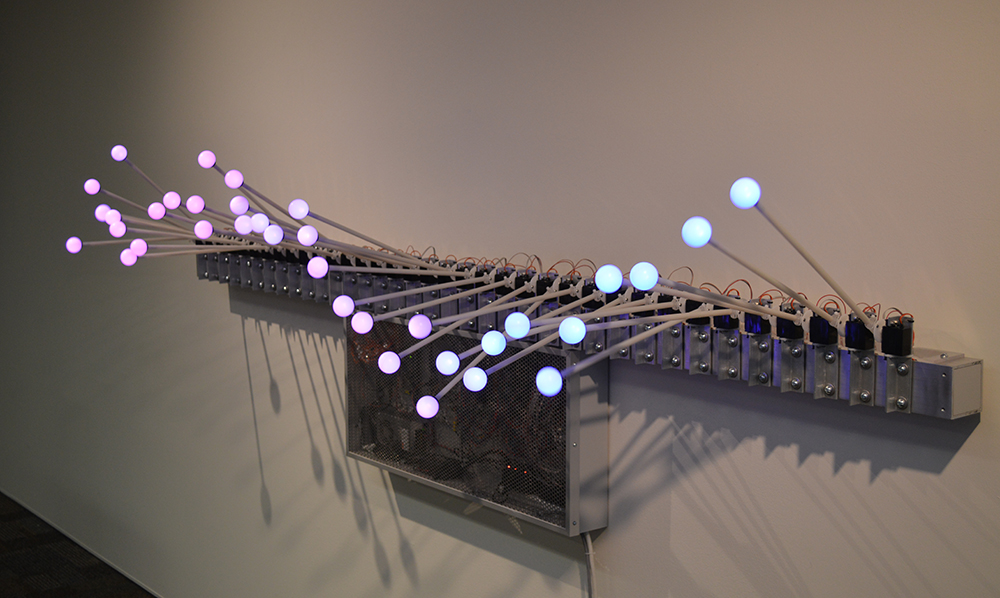
This programmable sculpture can display an infinite number of oscillating waves based on inputted data. Cartwright uses data from a wide variety self-recording projects to create moving graph waves. Data values can be illustrated by the angle of the rods or the color of the LEDs.
The data sets for the initial exhibition of the piece at Fermilab included:
1. Elevation (orange rod angles) and latitude (green rod angles) from cross-country bicycle ride May 20 – August 7, 1997
2. Daily time awake (rod angles) and the difference between the length of daylight and time awake (color changes relative to from blue to green) 2015
3. Daily walking mileage 2015 (rod angles) and temperature (color changing from blue to red as temperature increases)
4. Daily temperature in Urbana, IL 2015 (color relative to rod angles)
5. Daily meditation time 2016 (color relative to rod angles)
6. Daily meditation time 2016 (green rod angles) alternating with daily meditation time moving average (purple rod angles)
7. Average daily wind speed in Urbana, IL 2015 (rod angles) and daily average temperature in Urbana, IL (color changing from blue to red as temperature increases)
8. Average daily temperature in Urbana, IL (blue rod angles) alternating with average daily wind speed in Urbana, IL (green rod angles)