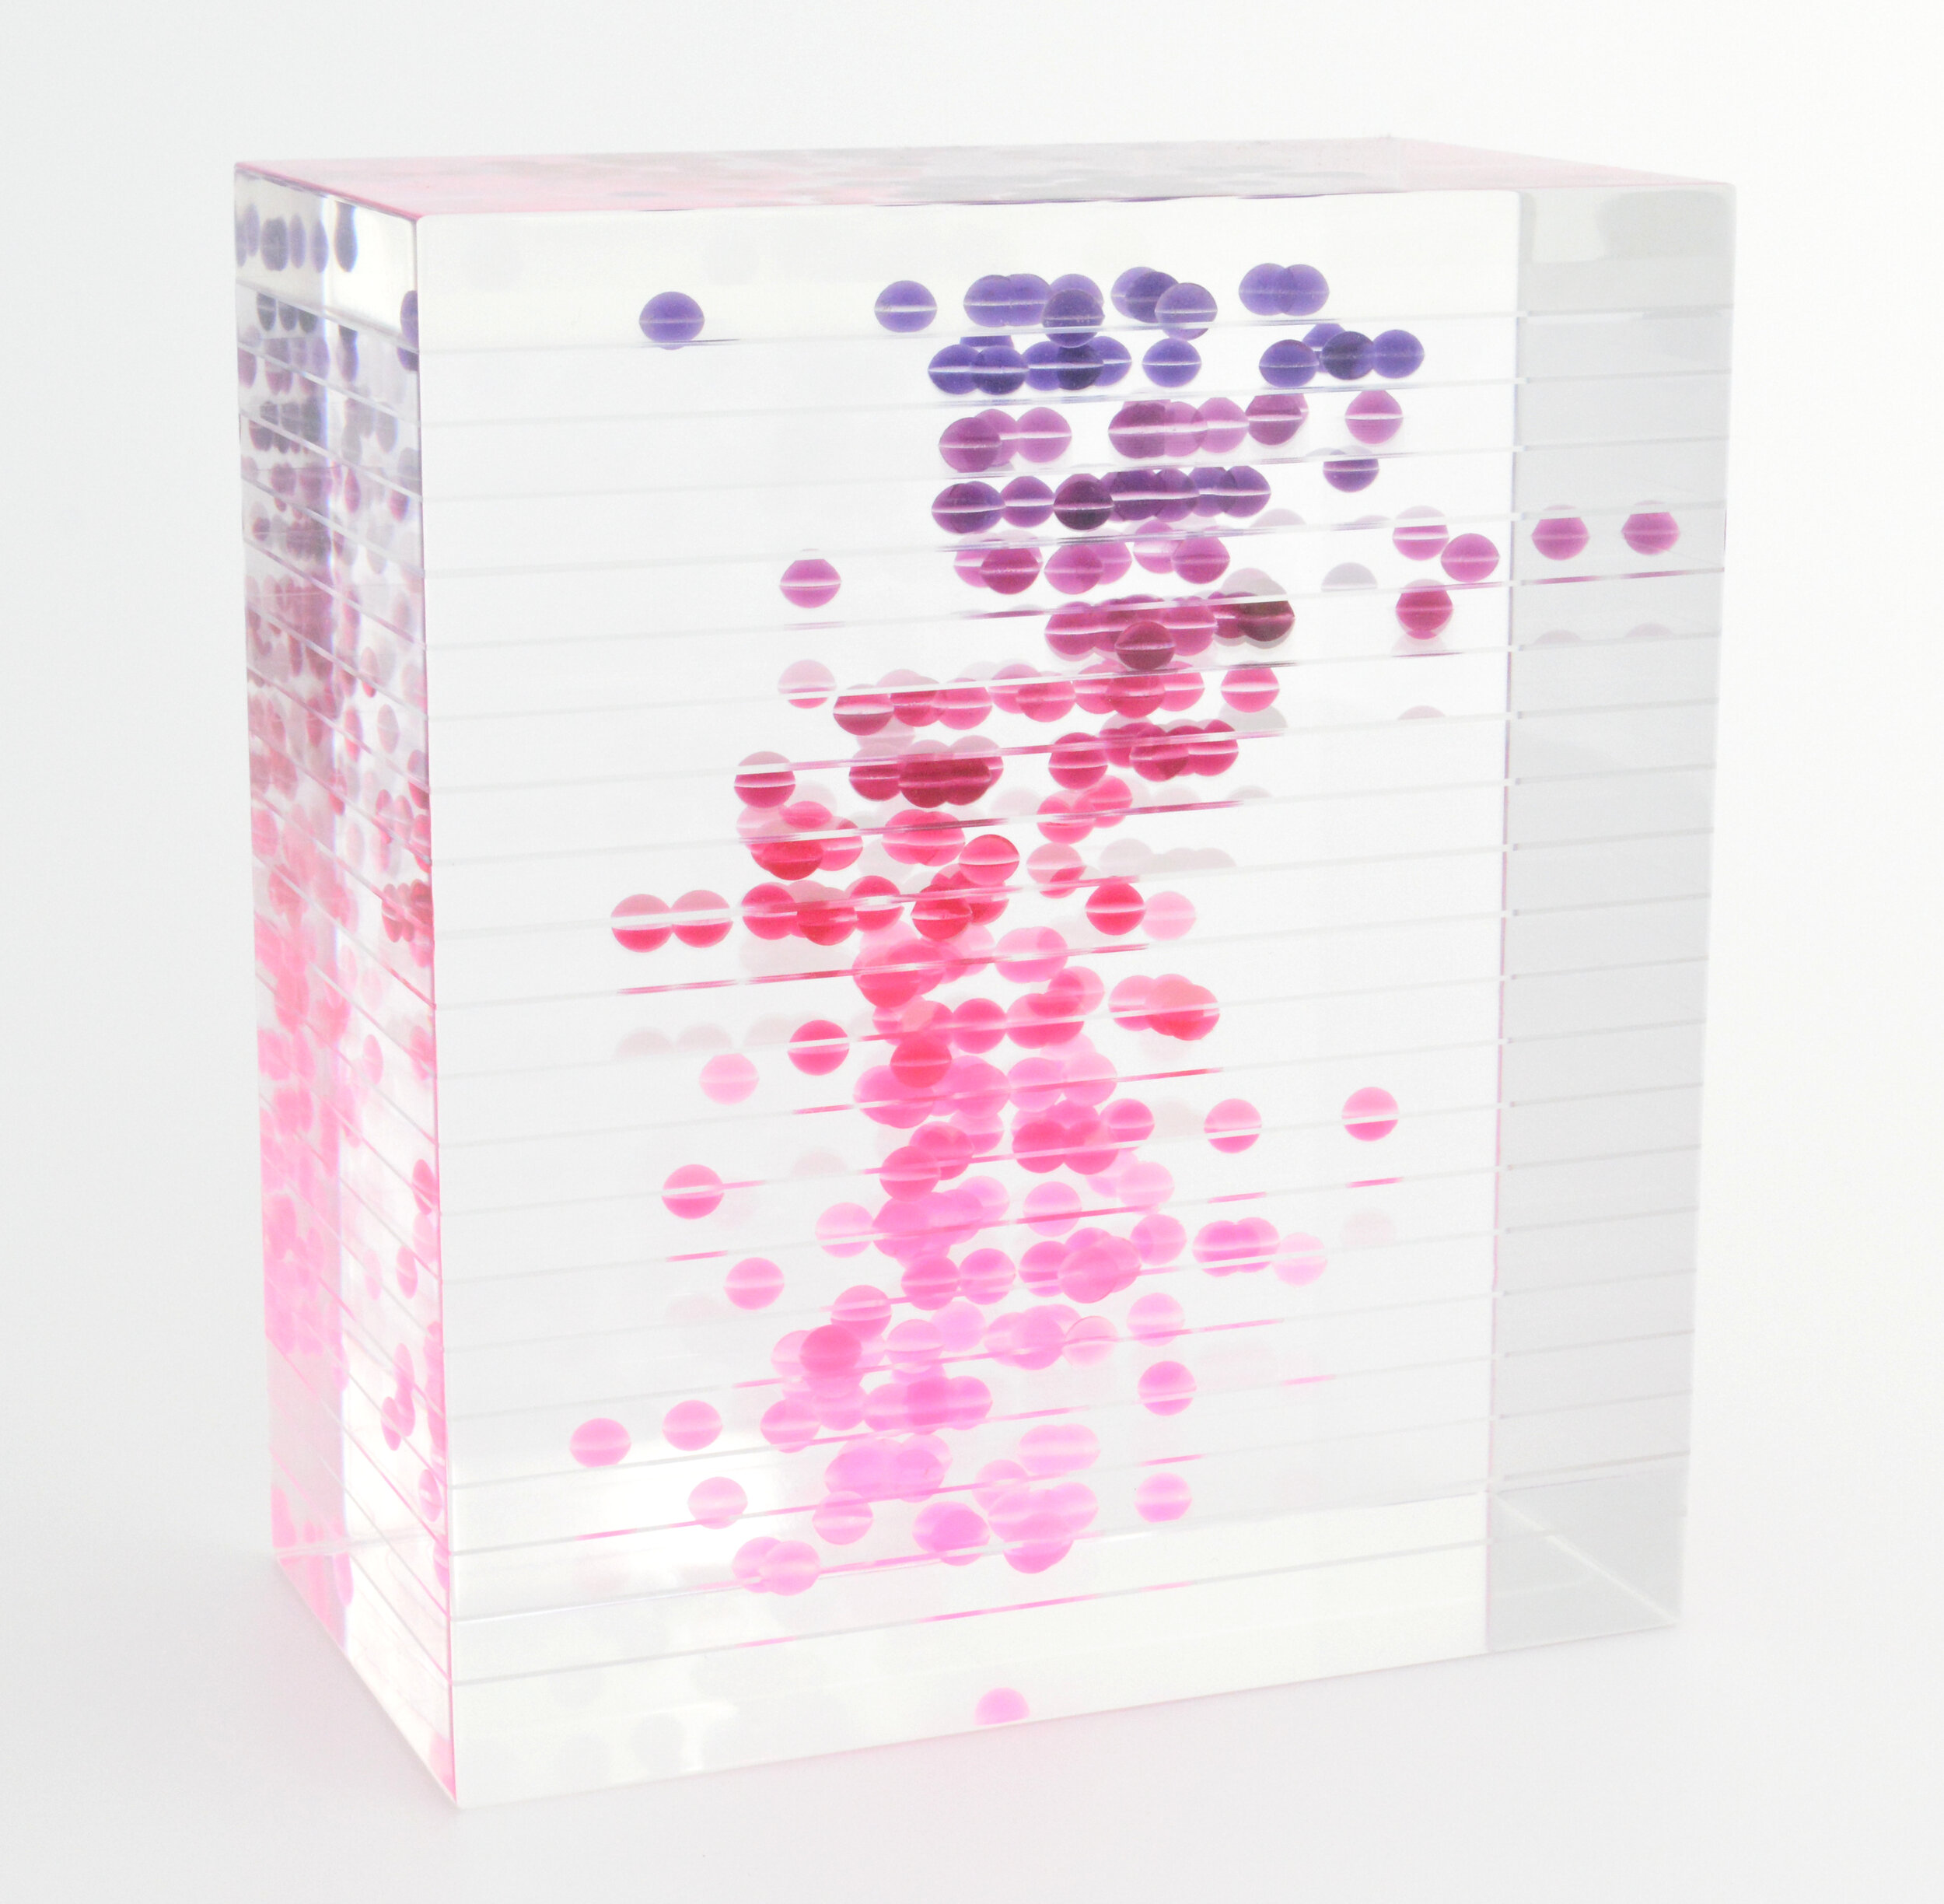


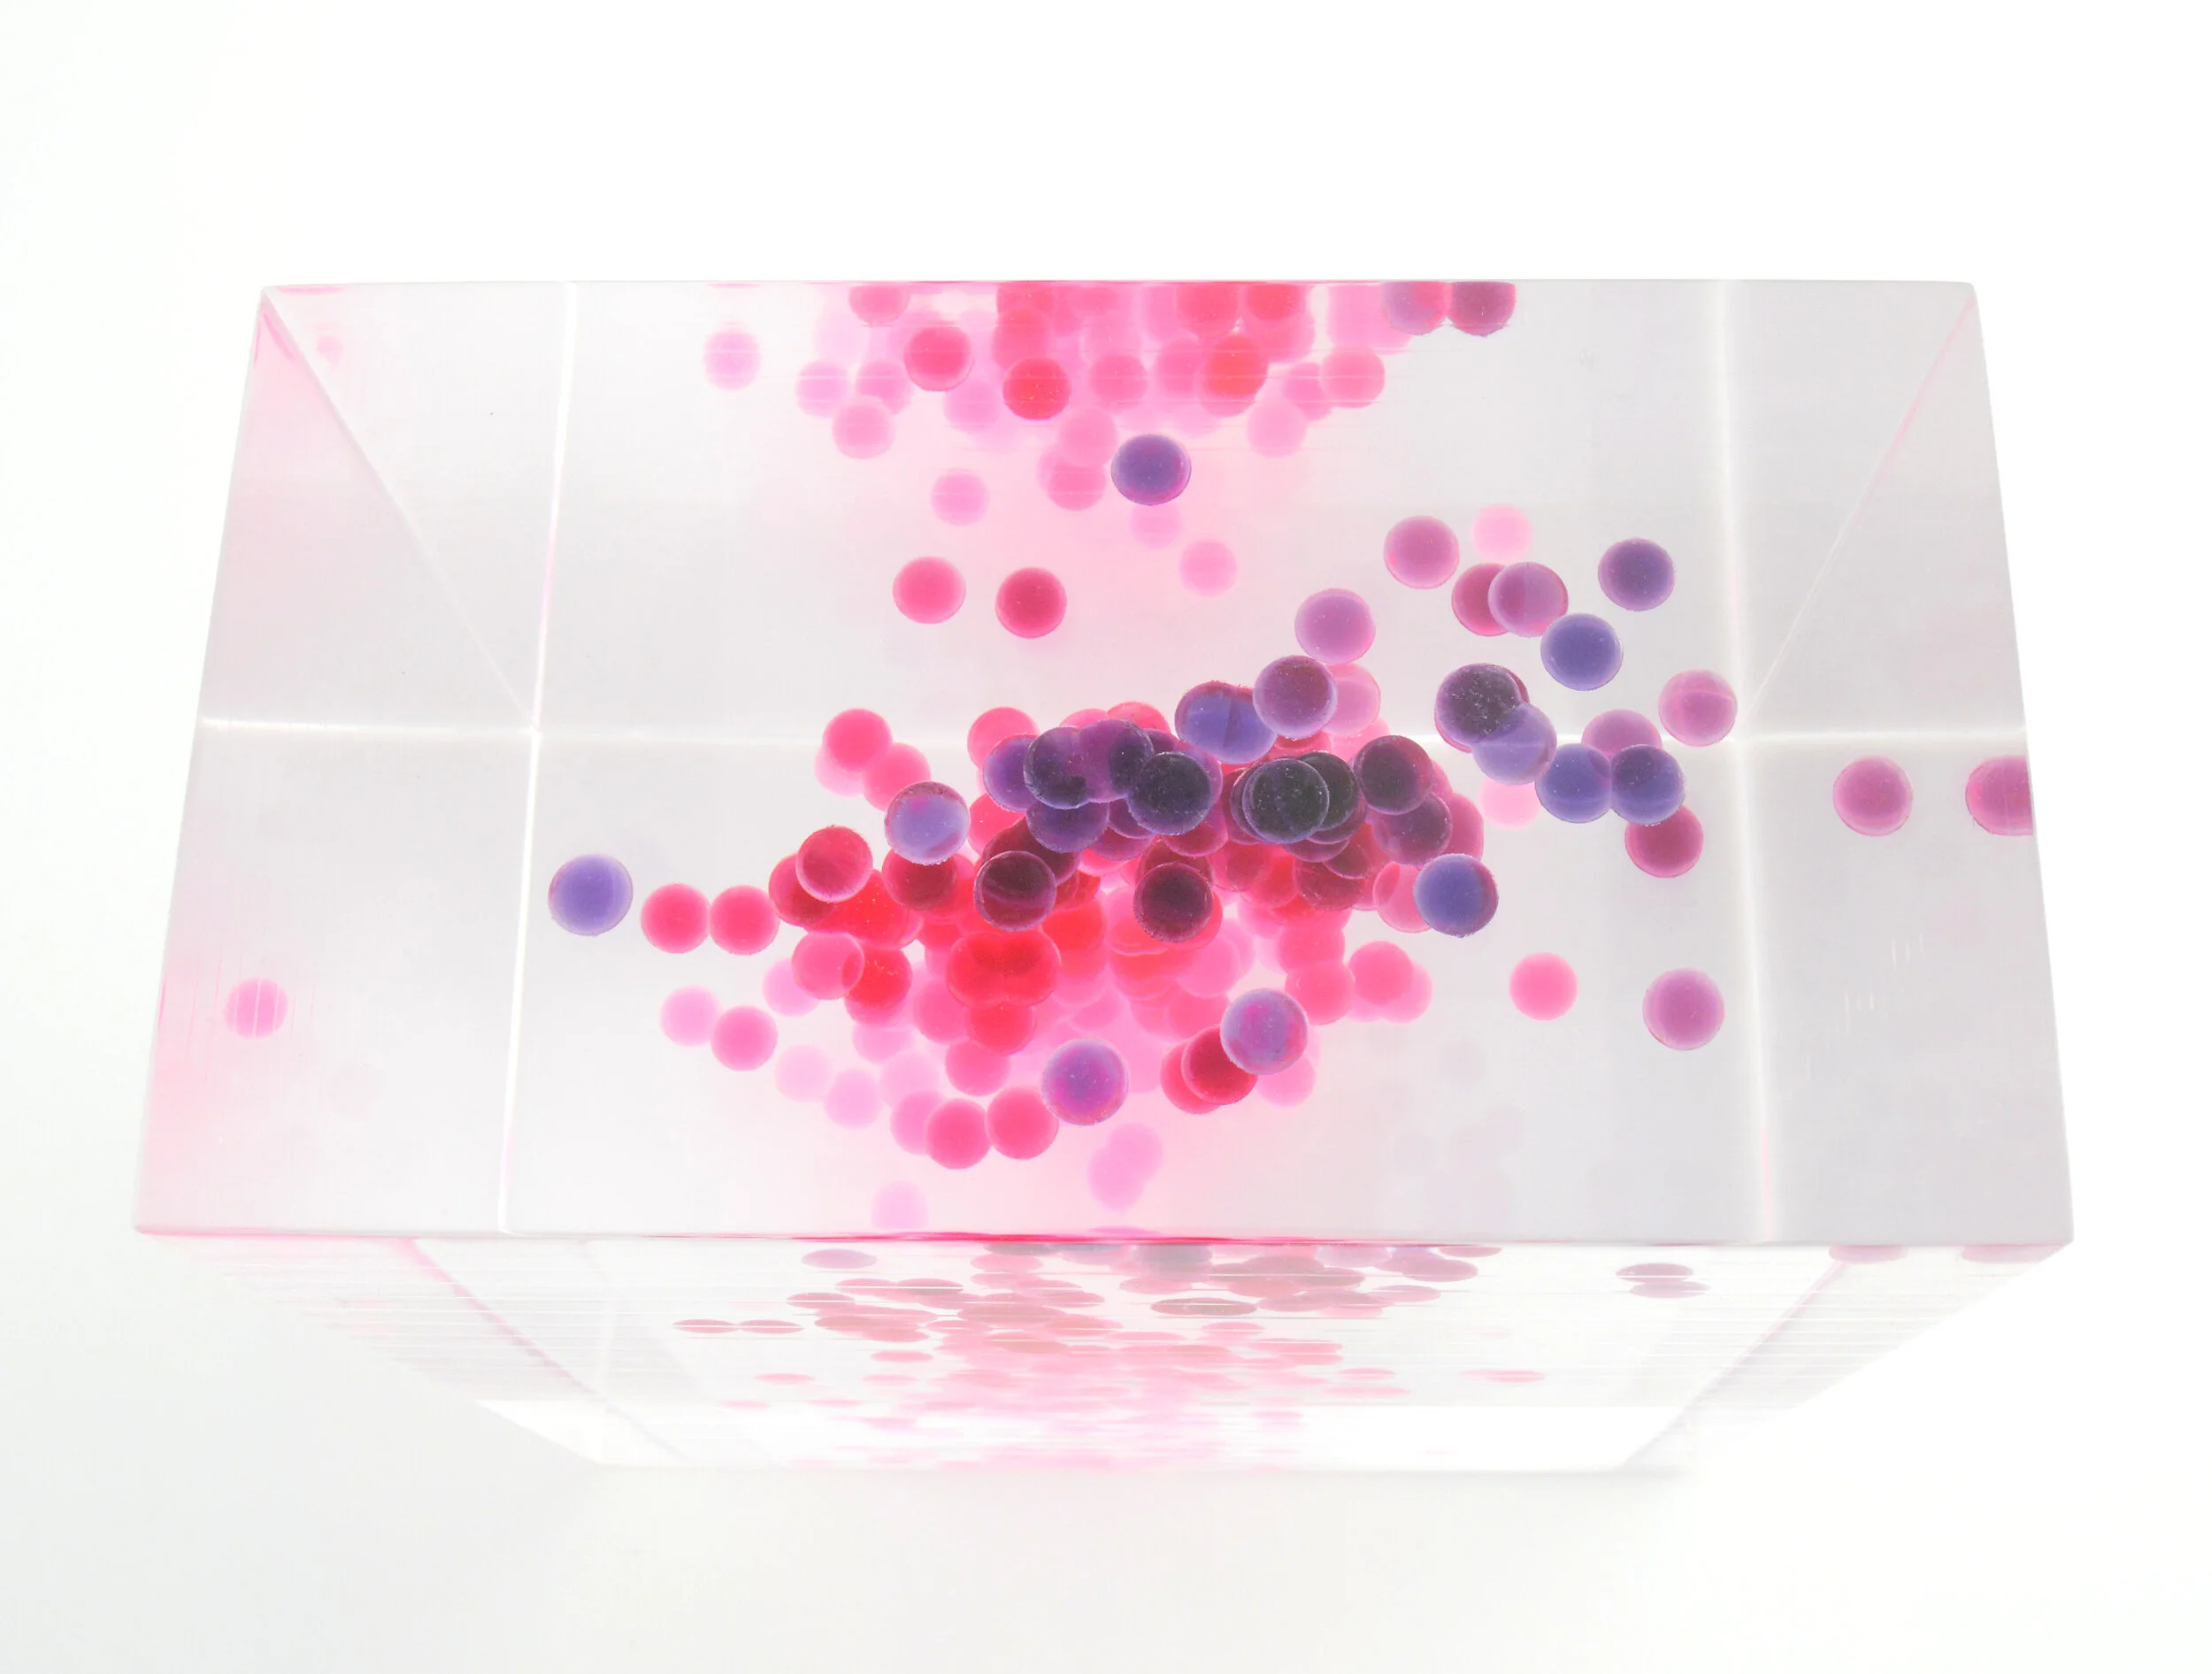
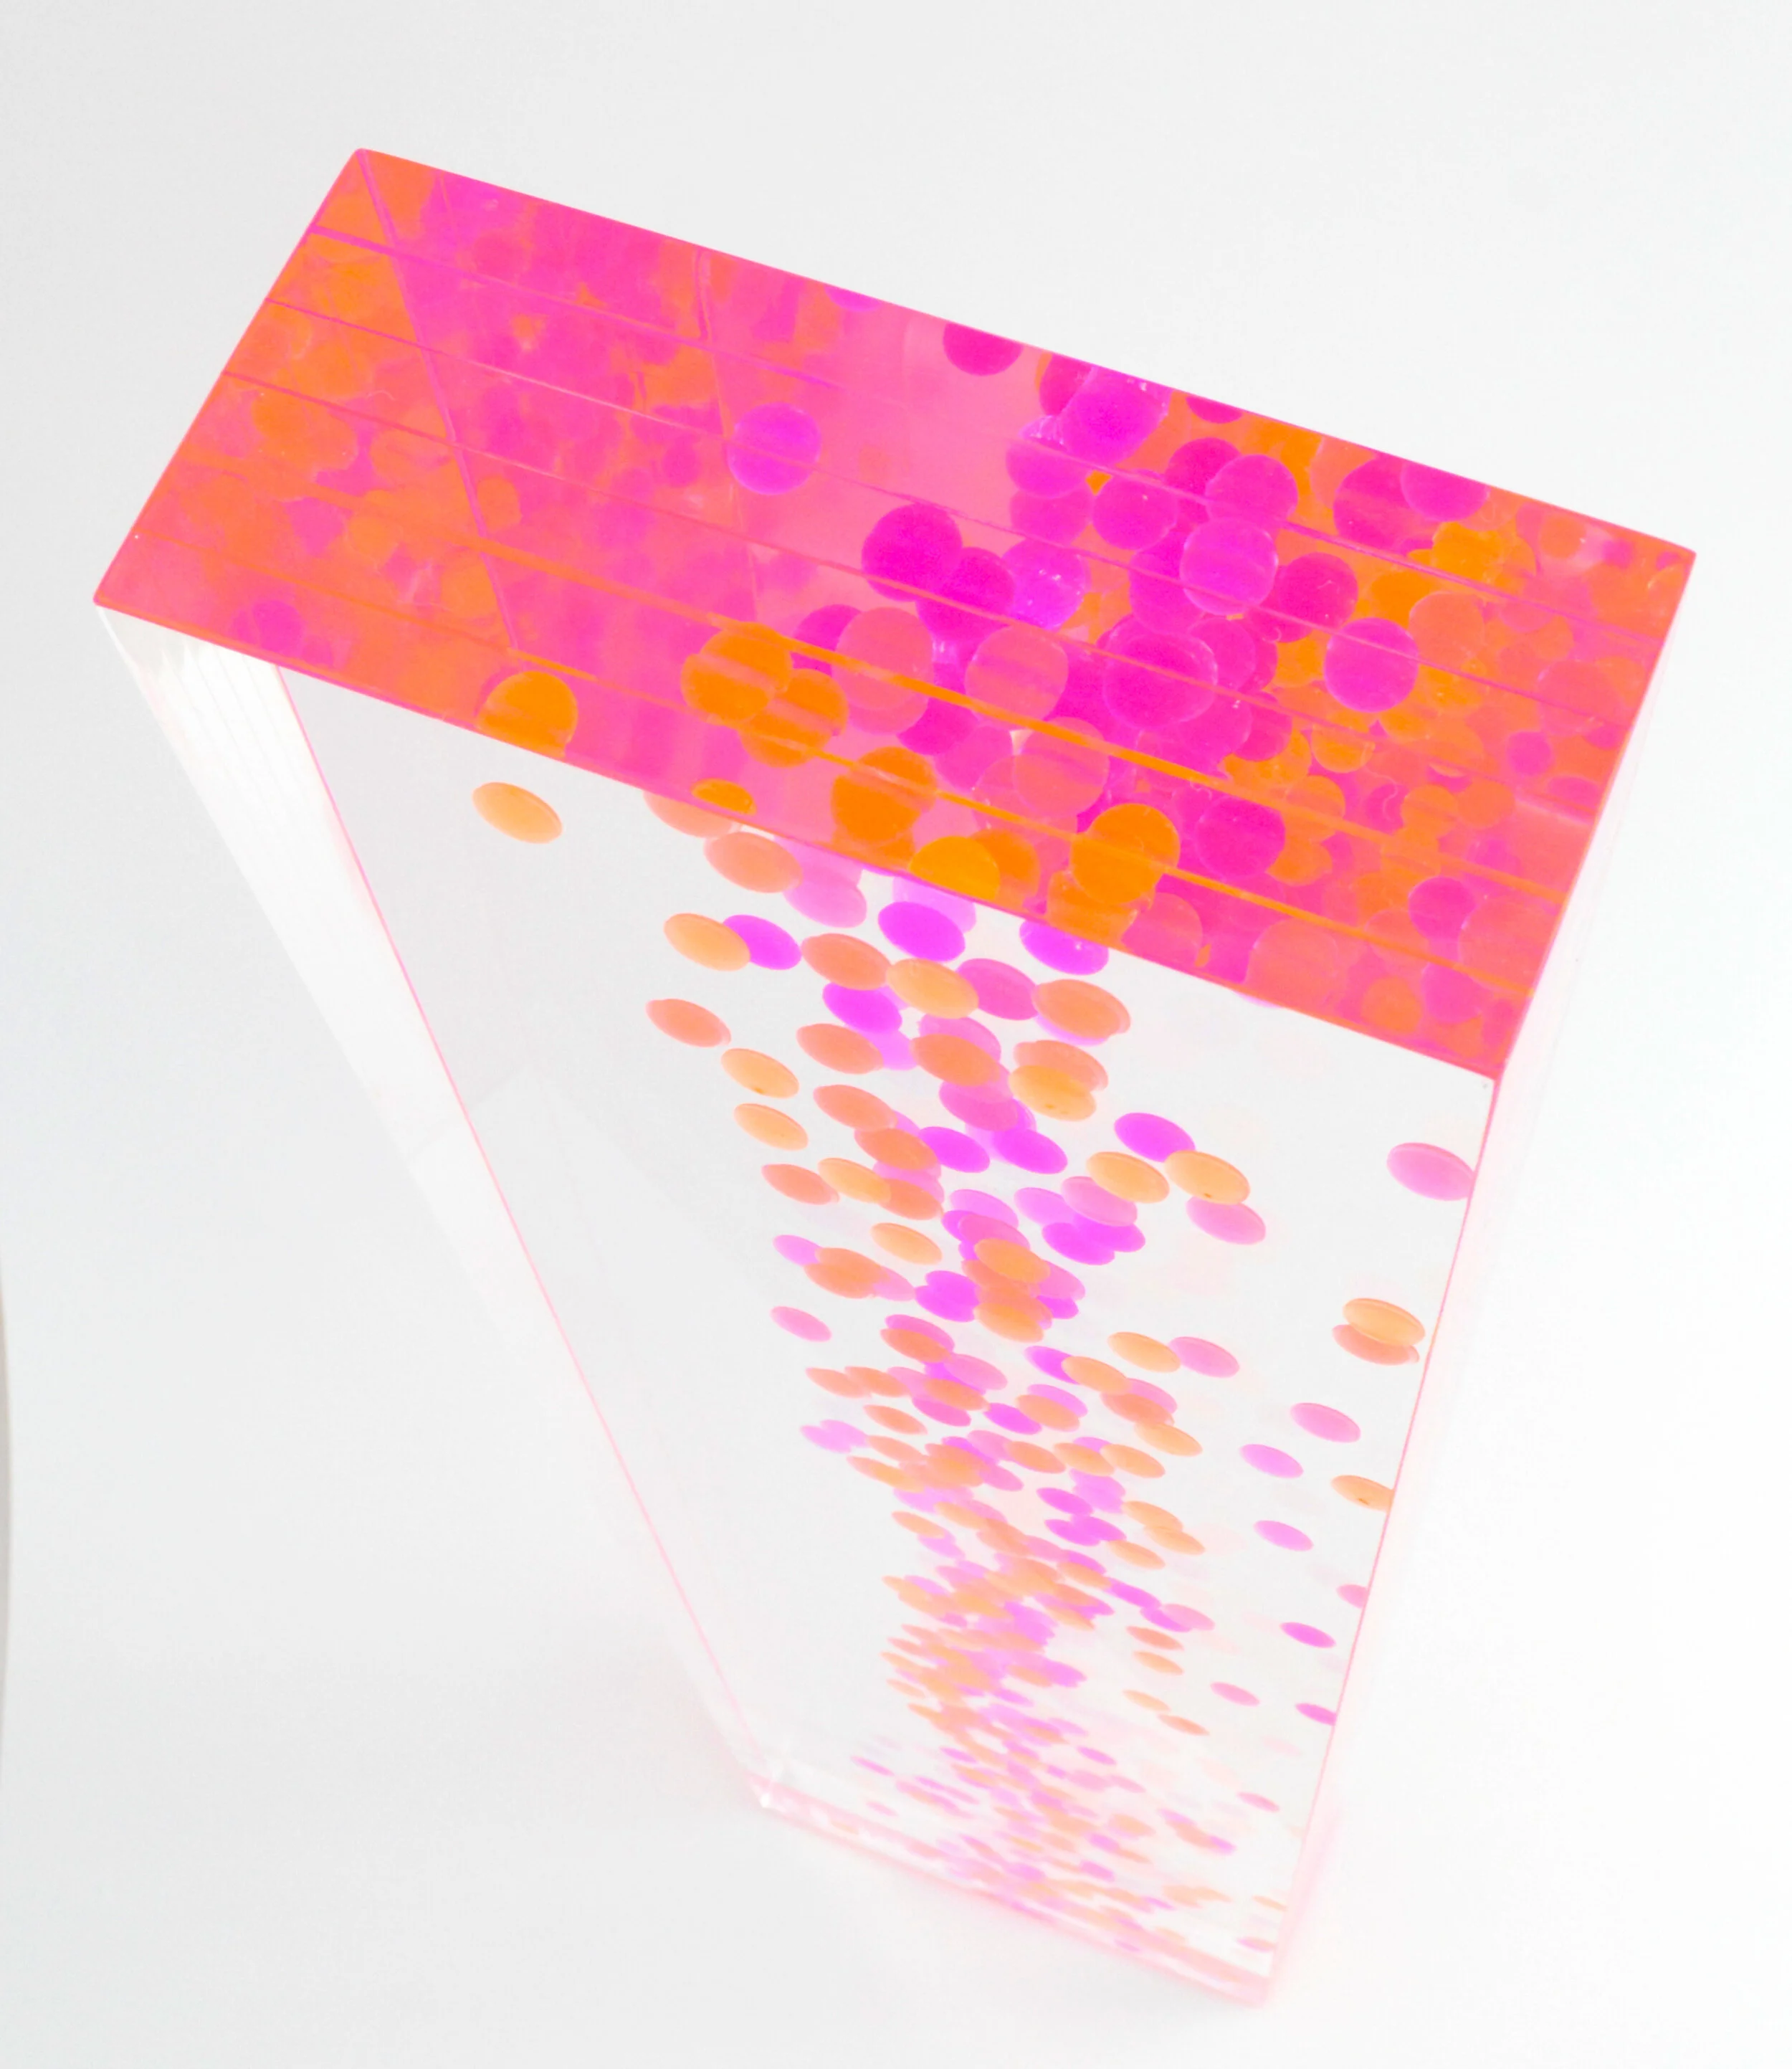
![Floating Information (Los Angeles Weather 2000-2019) 2020 | Acrylic, resin | 8.5 x 7.75 x 4.25 in | [private collection] This piece tracks the deviation from the monthly average temperature and precipitation over 20 years.](https://images.squarespace-cdn.com/content/v1/58013a4b2e69cf0ff835c589/1605554045347-60M7C6M07K96K68BGMWZ/LA_Weather8.JPG)
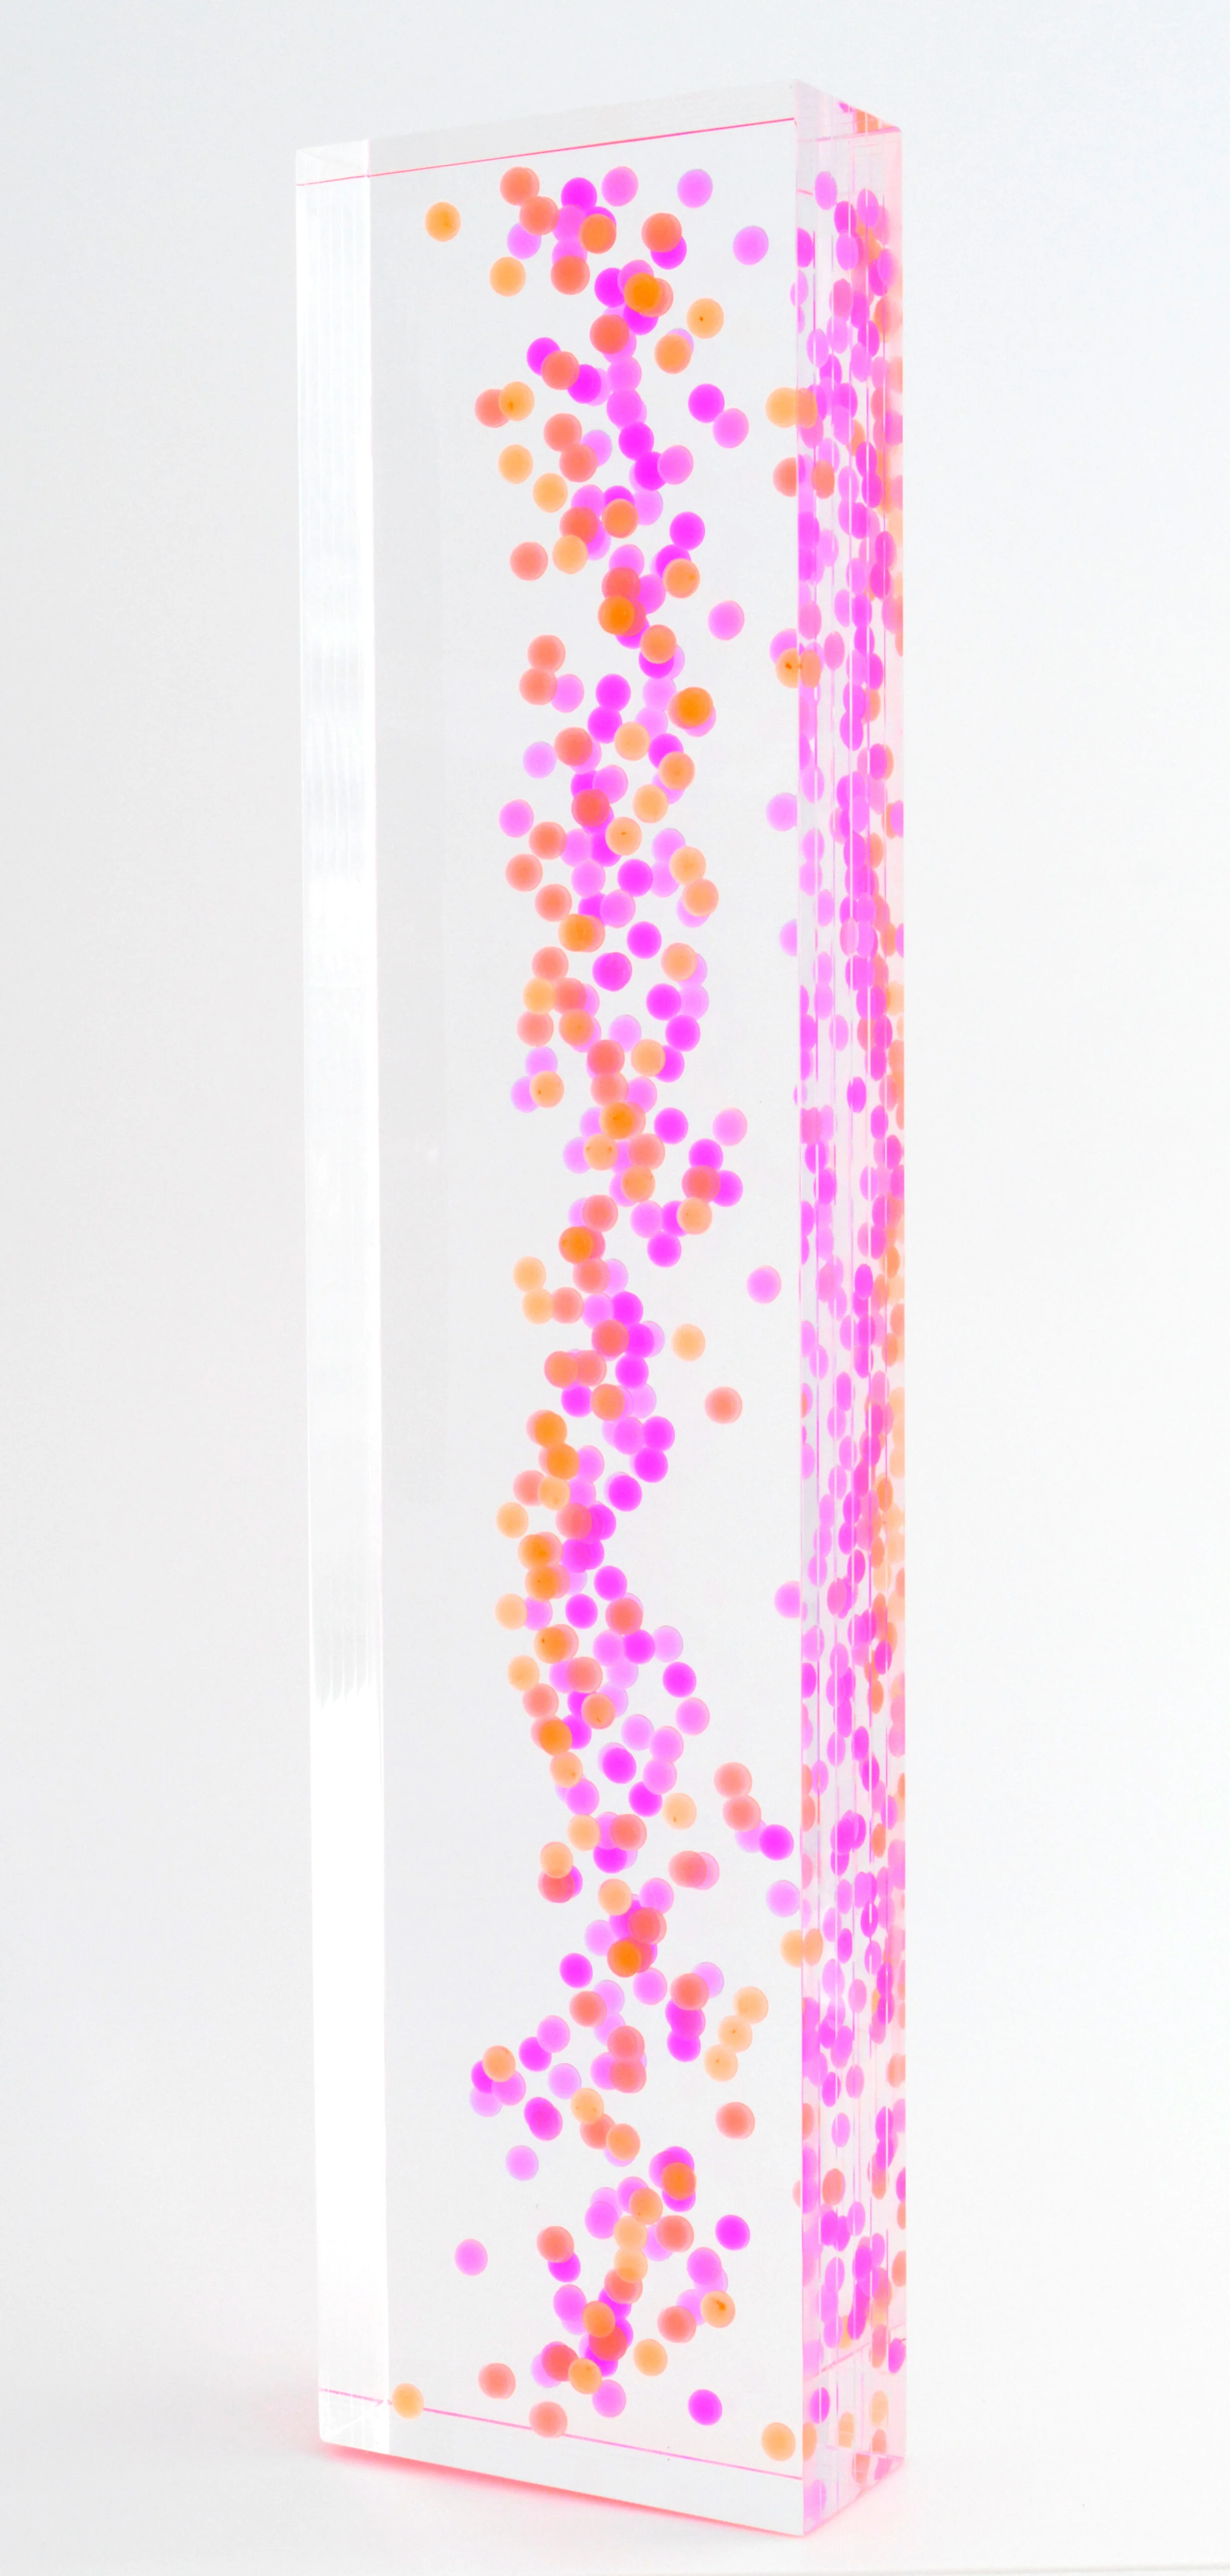
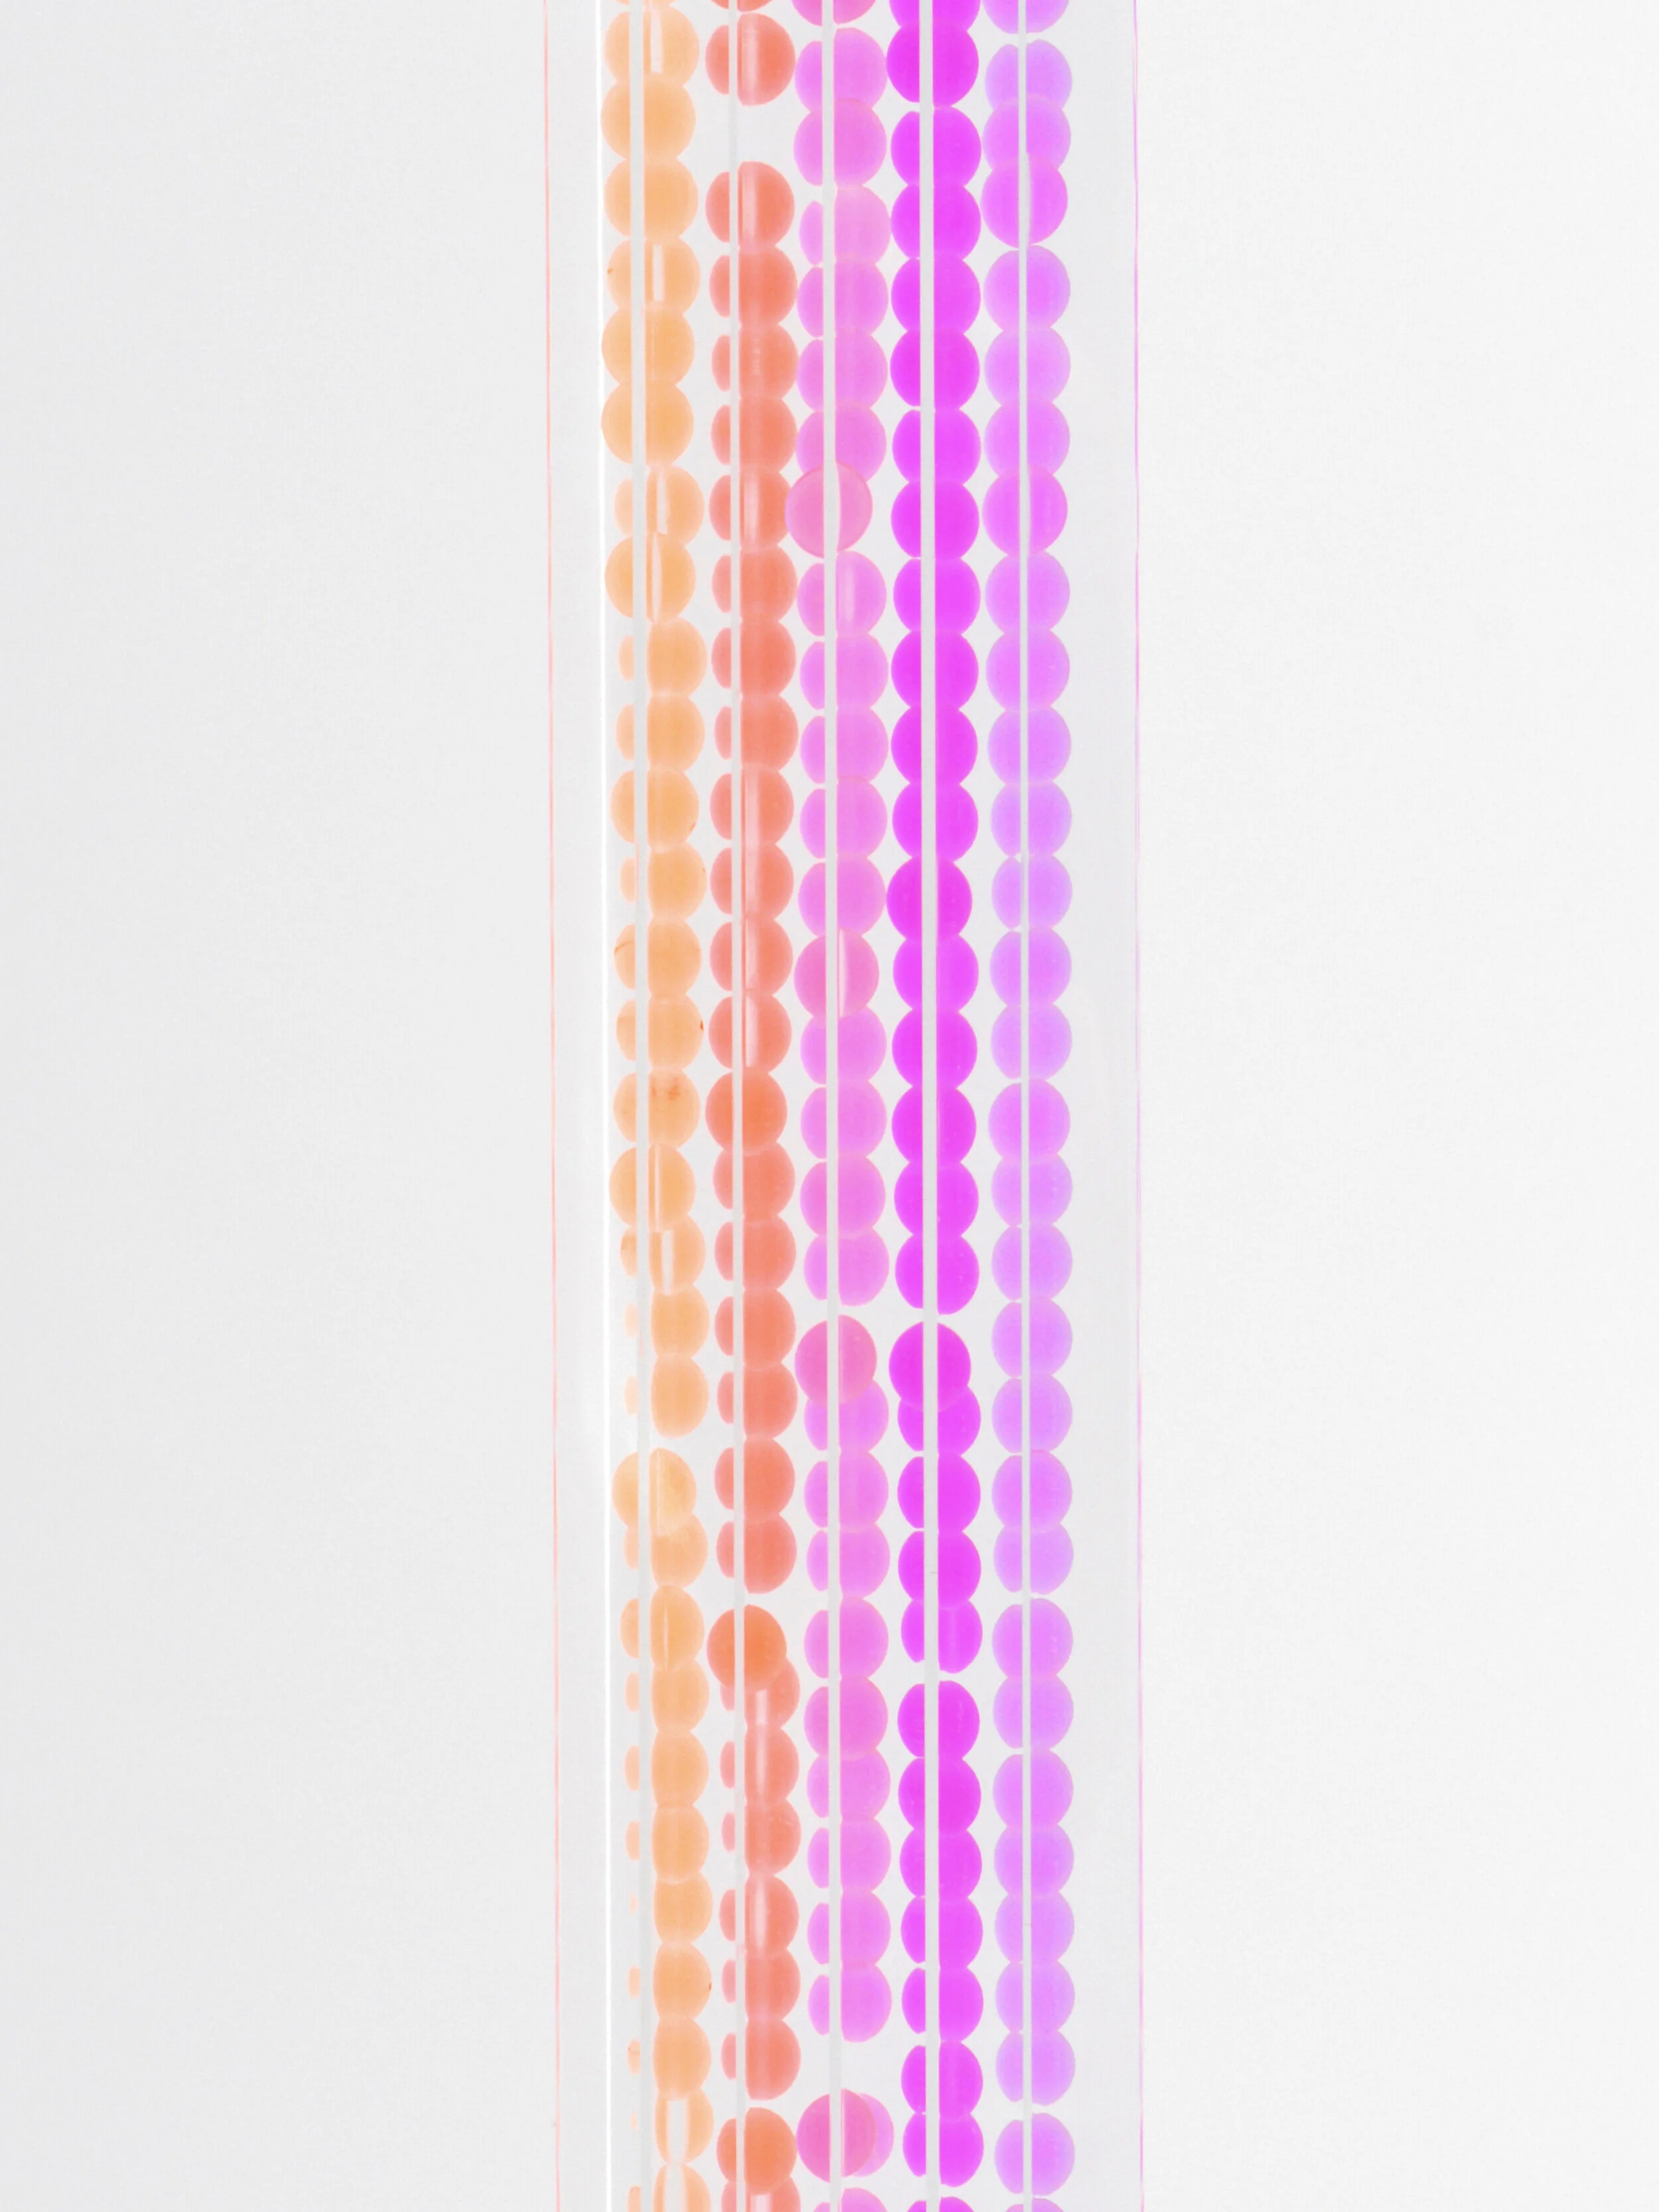


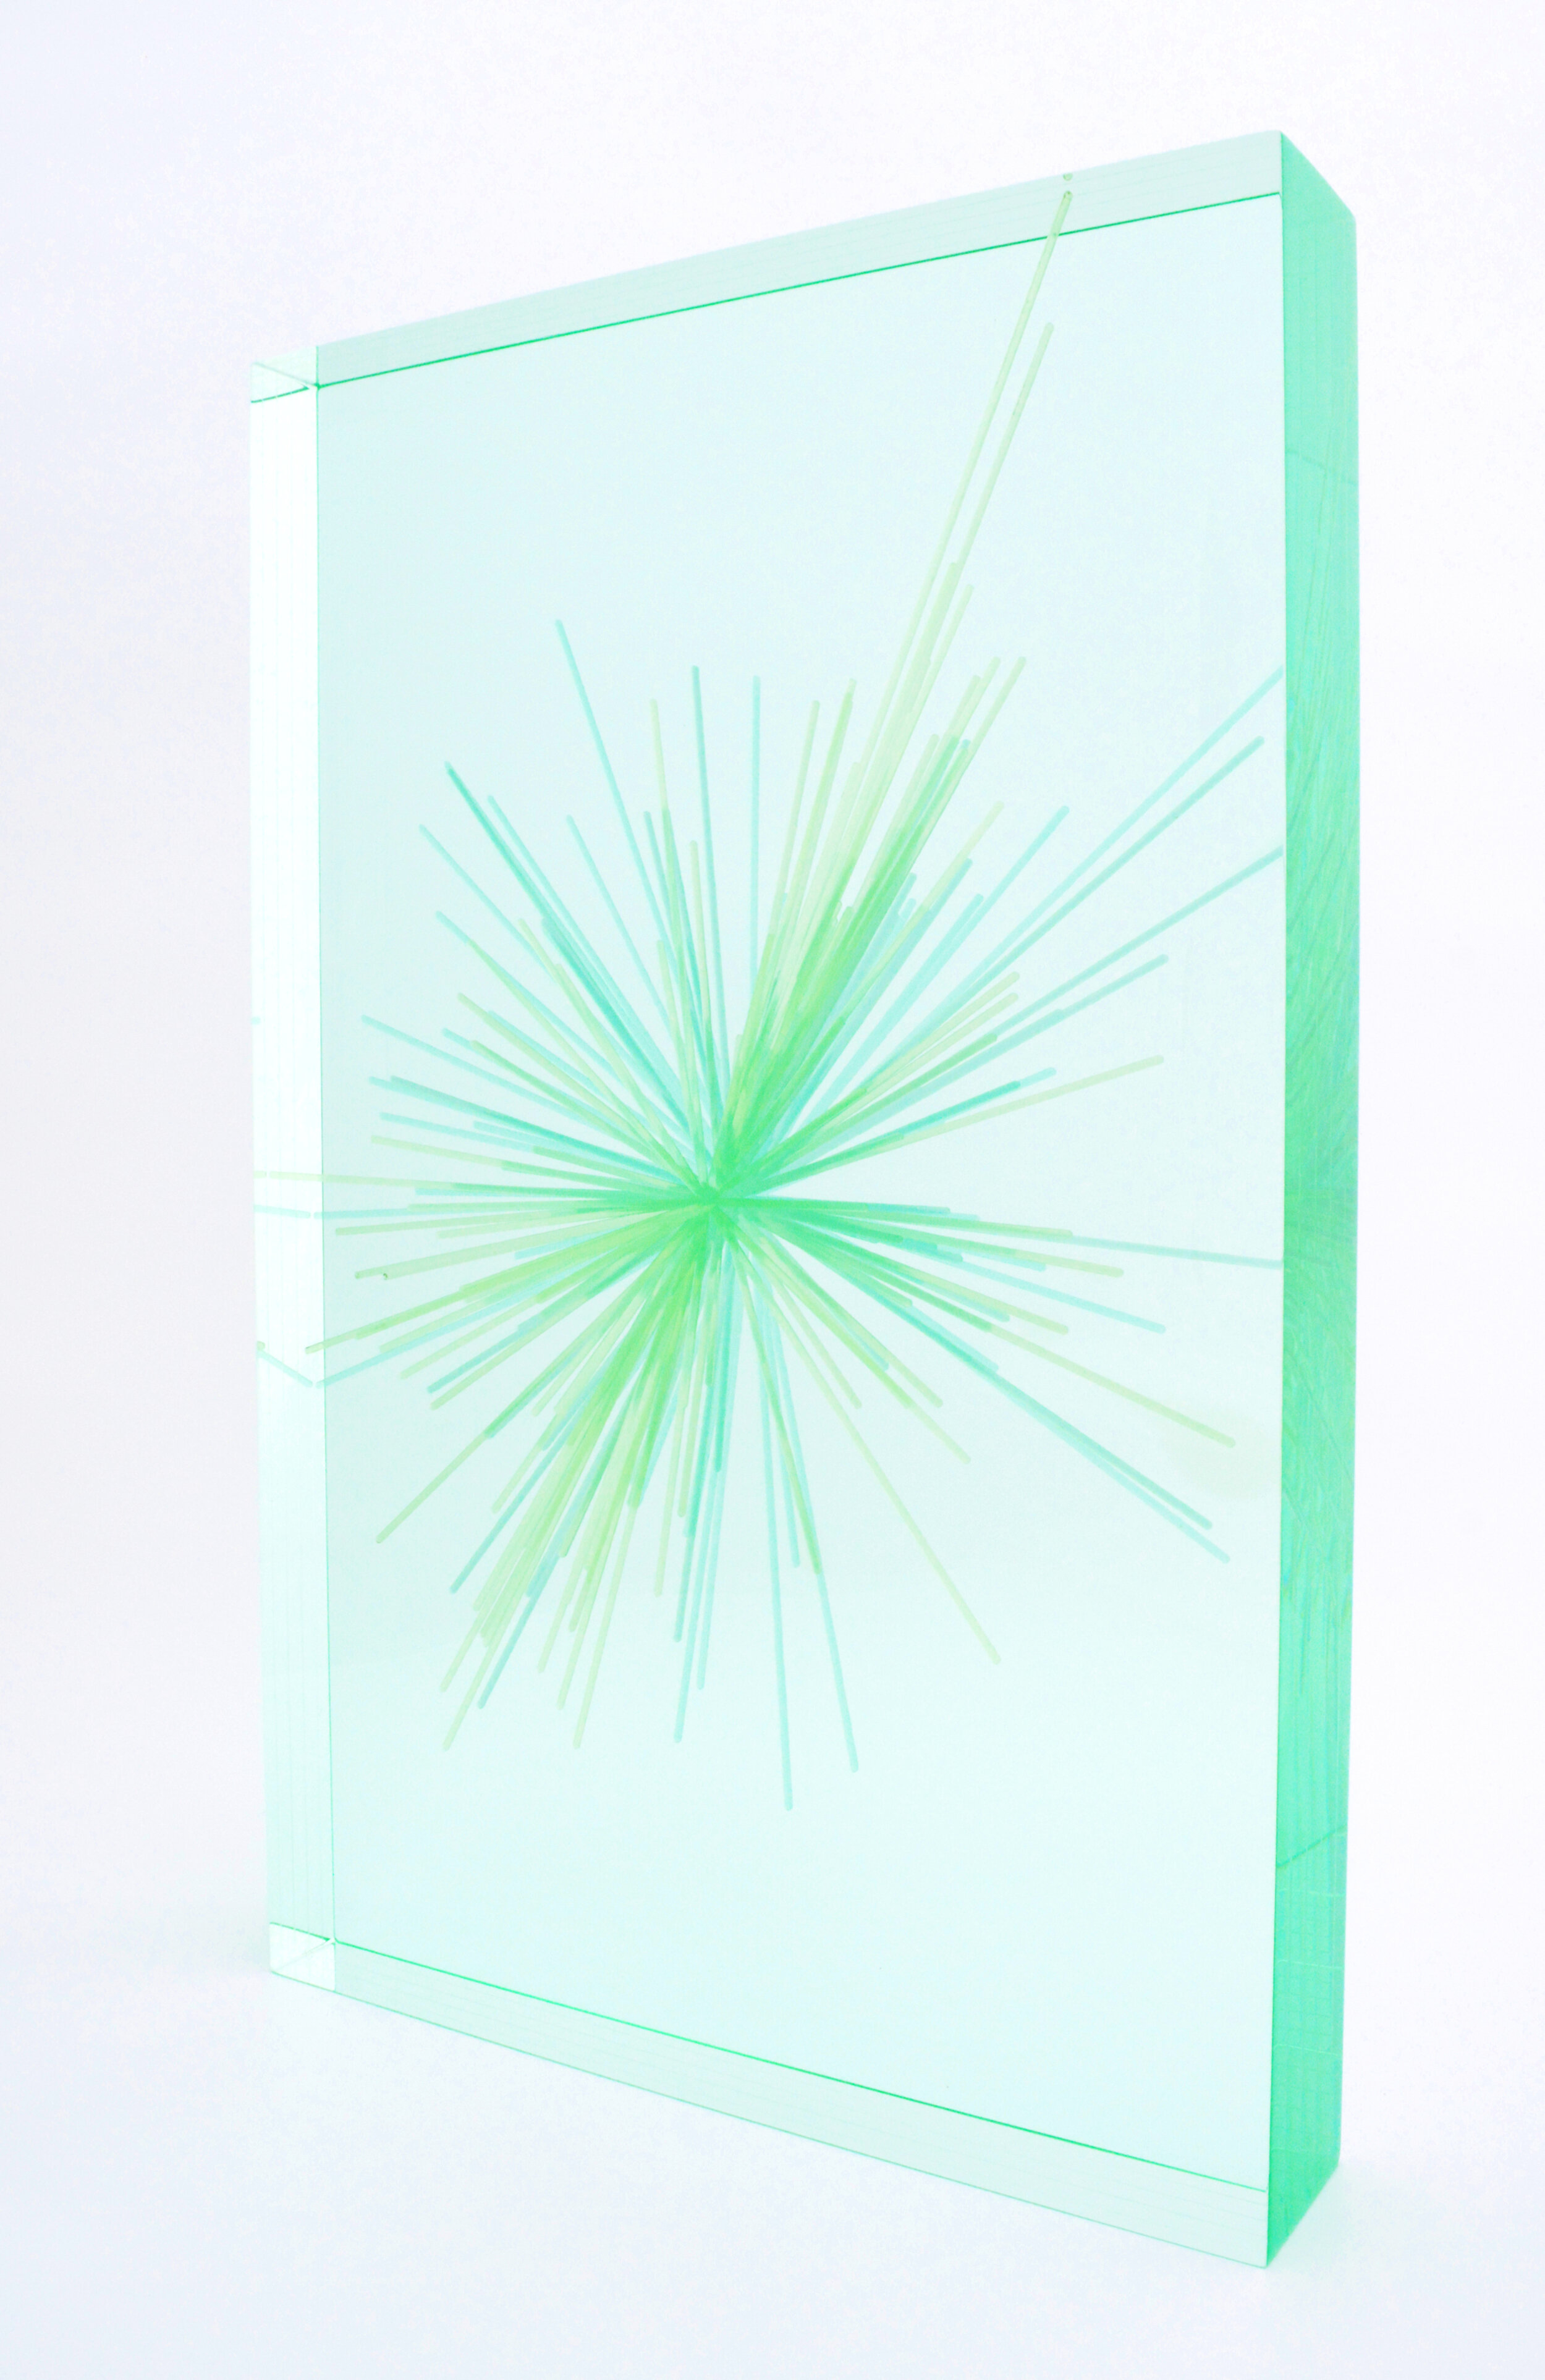
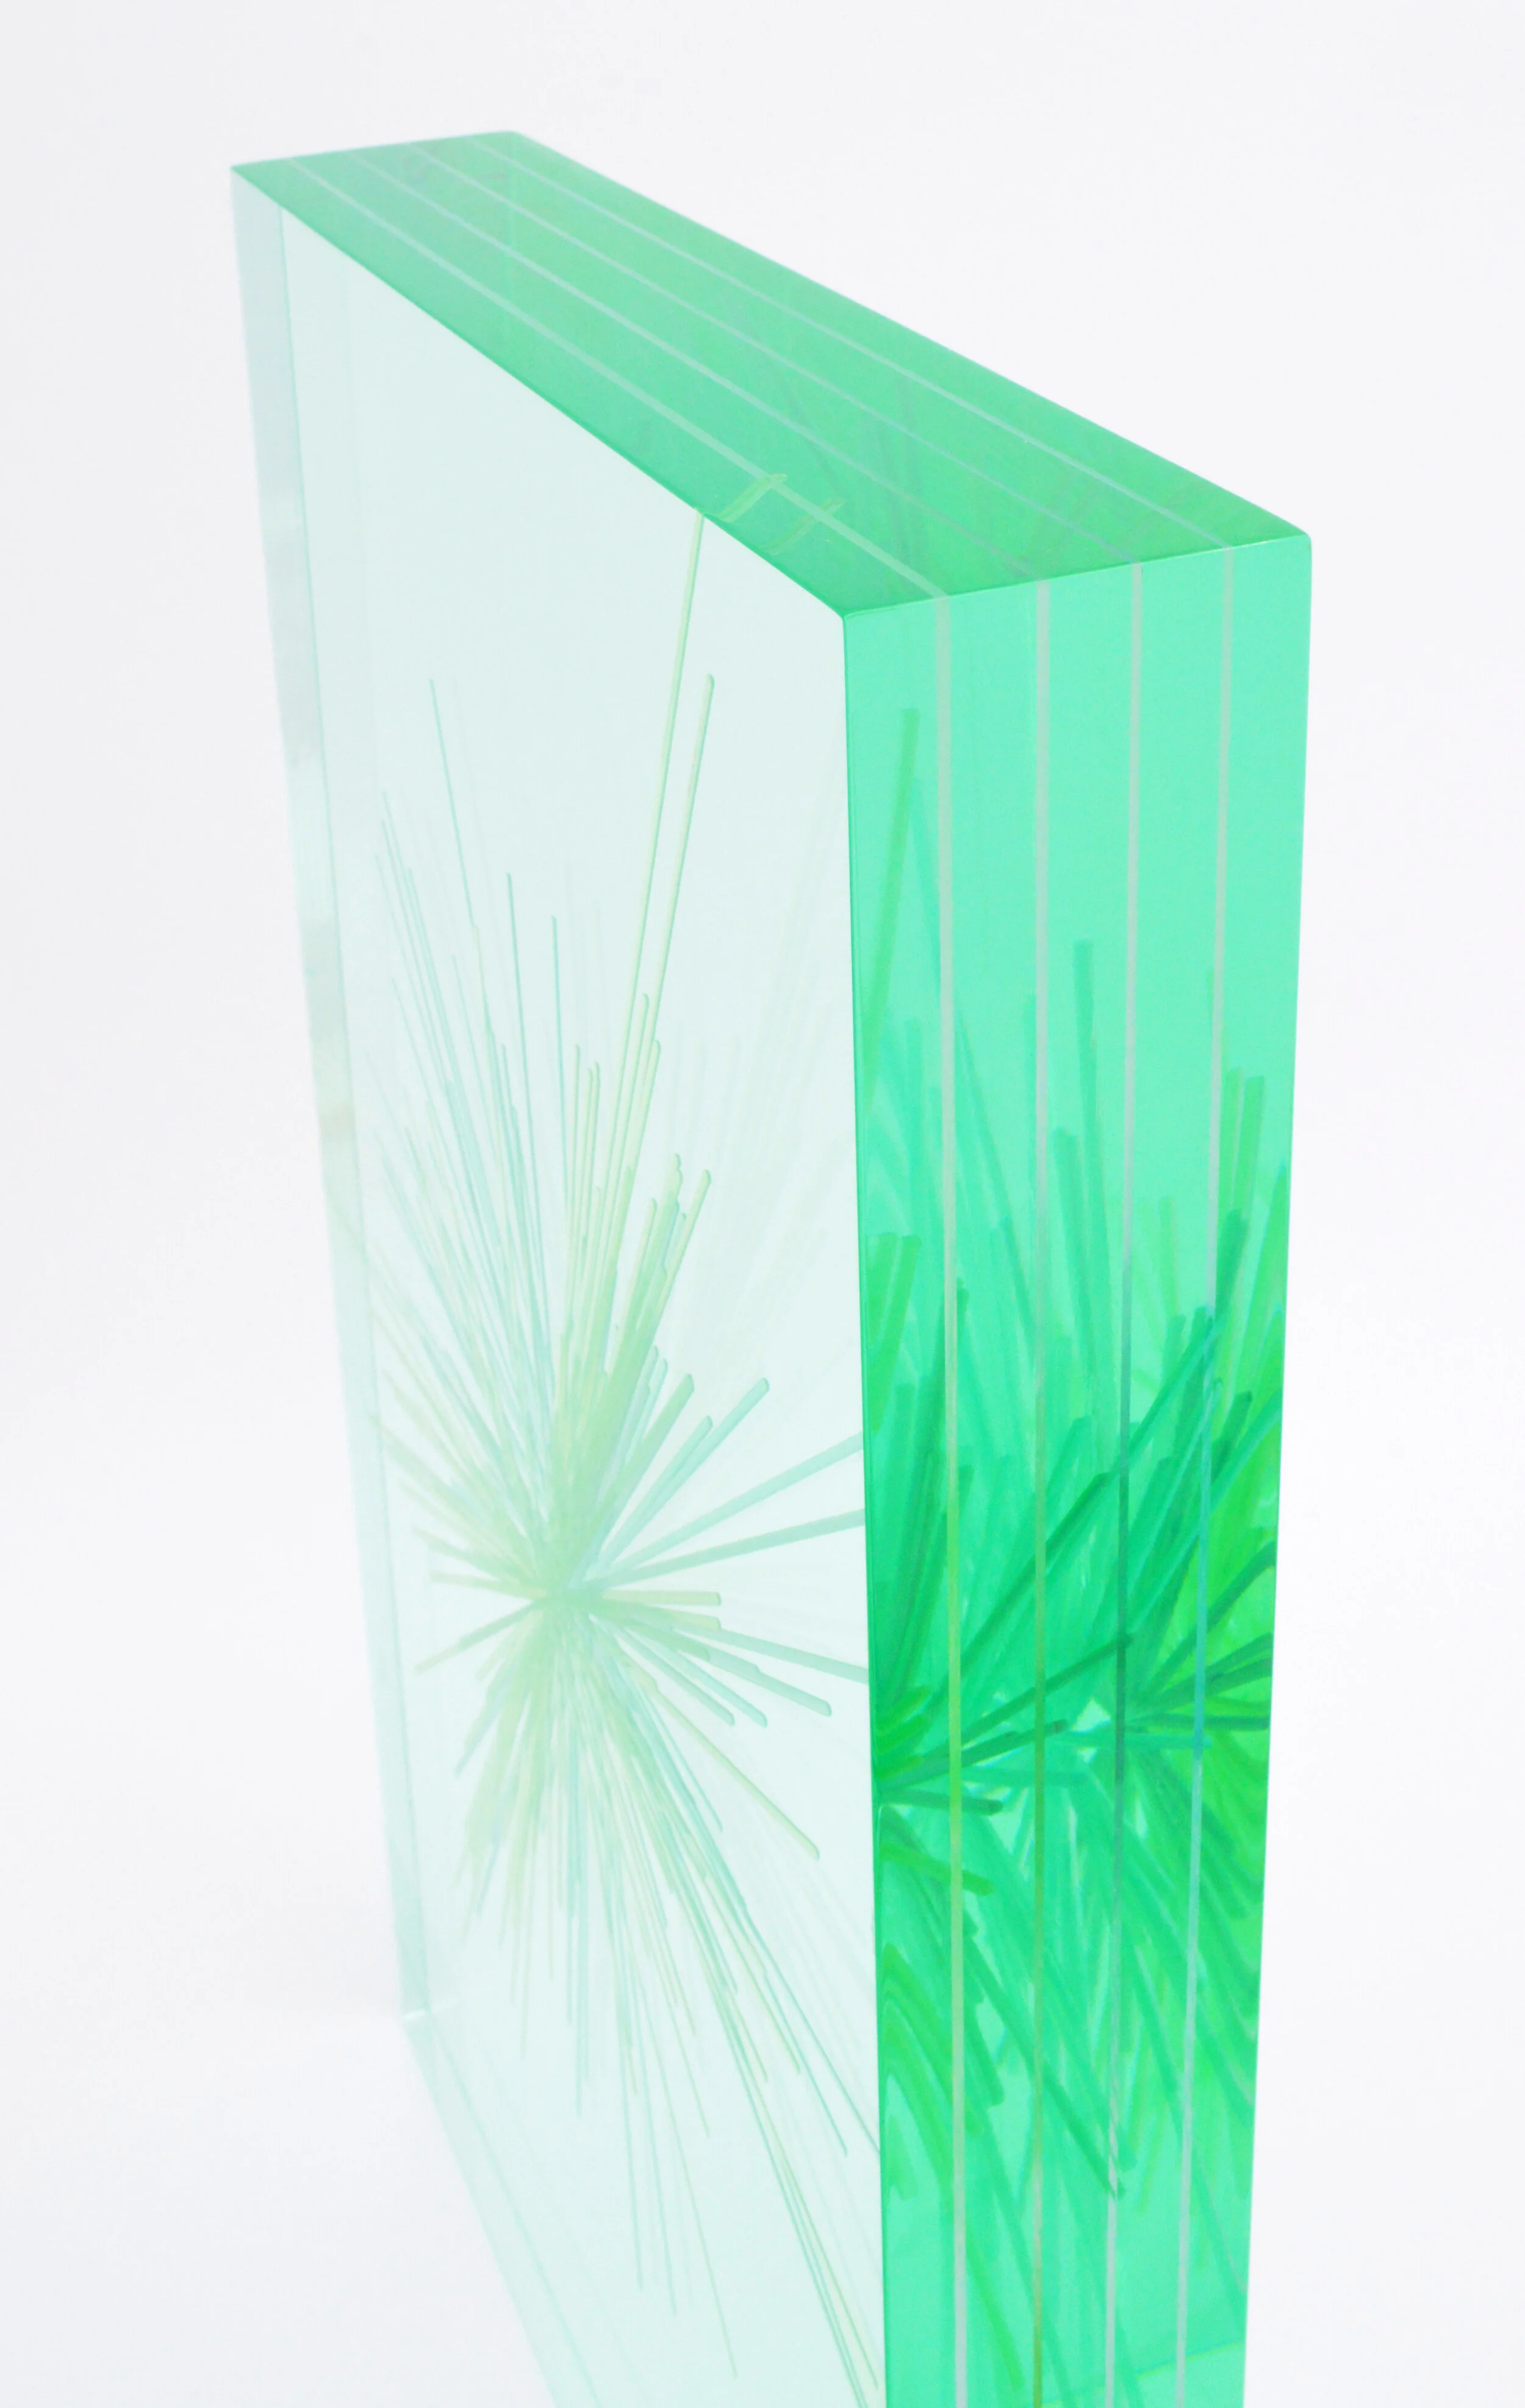
![Floating Information (Prevailing wind 2017-20: San Francisco and Miami) 2021 | Acrylic, resin | 14 x 21 x 2.5 in | [private collection] This piece shows a sampling of of the prevailing wind direction and speed data from two cities covering 2](https://images.squarespace-cdn.com/content/v1/58013a4b2e69cf0ff835c589/1612993995963-MU3ZO9VPJ6Y1HJQ5PE1L/Wind-SFO-MIA4.JPG)
/
1
2
3
4
5
6
7
8
9
10
11
12
13
14
15
16
17
18
·
·
·
·
·
·
·
·
·
·
·
·
·
·
·
·
·
·