2014
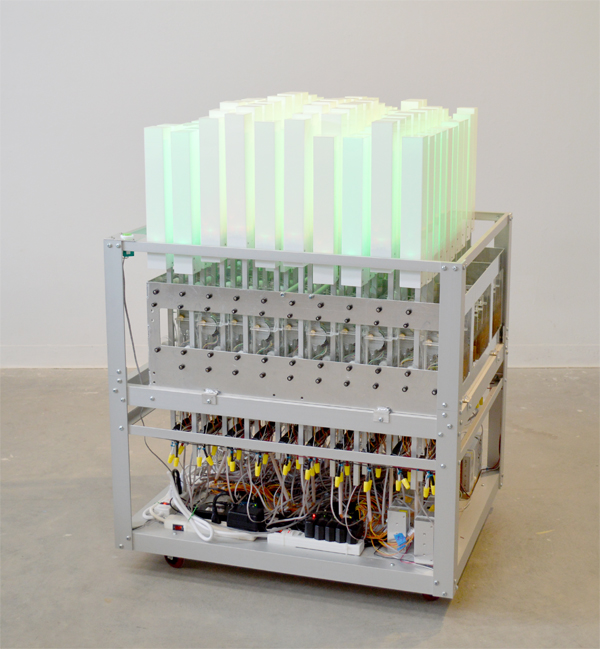
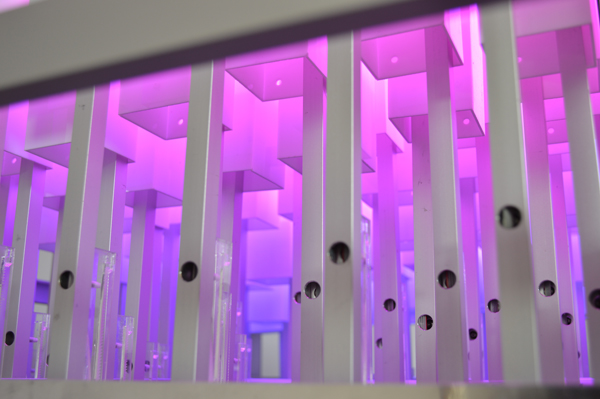
30x36x60in
LEDs, acrylic, aluminum, motors, electronics
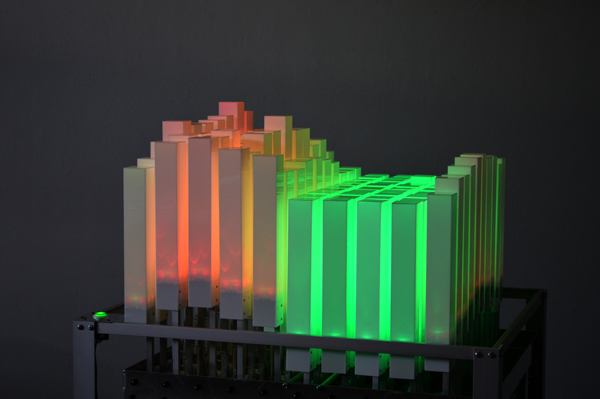
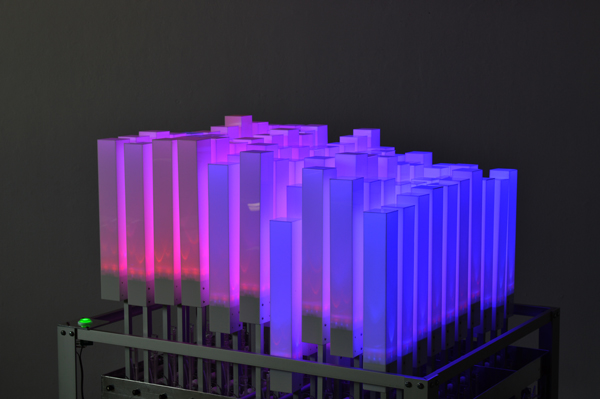
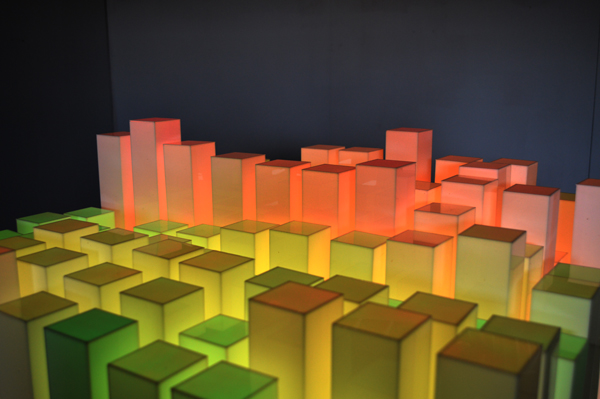
This programmable sculpture can display an infinite number of topographies based on a wide variety of inputted data. Cartwright uses data from a wide variety self-recording projects to create new moving landscapes. Each column on the 10x10 grid can move vertically depending on the value of discrete data points within the set. The color of each column can also be changed based on inputted data. Data sets can scroll across the machine row by row or the entire surface can change with each pulse of the machine. In these images the the daily temperature in Urbana for the entire time that Cartwright has lived there colors the columns red to blue. The higher the temperature the higher the column. Cold temperatures turn the columns blue while warmer temperatures turn the columns red. The green-yellow-red sequence on the machine is generated from family latitude data.